Learn how to calculate application completion rate, benchmark it against industry standards, and apply data-driven tactics to reduce candidate drop-off
Only about 6% of people who click a job ad complete an application, and that single metric can reveal more about funnel health than an ATS dashboard shows on its own. The application completion rate measures the distance between initial interest and a submitted application, exposing friction that raw applicant volume can hide.
That makes the metric more than a form-design KPI. A low rate may point to lengthy questions, poor mobile usability, unclear qualifications, or a slow response process after submission. In audited hiring funnels, the key question isn't, “How do we get more candidates to apply?” It's, “Where does candidate momentum disappear?”
Only about 6% of people who click a job ad complete an application, based on CareerPlug's 2025 Recruiting Metrics Report, which analyzed more than 10 million applications across 60,000-plus businesses. The same broader benchmark picture shows that application completion is a narrow passage between candidate interest and recruiter visibility, not a minor administrative detail. (CareerPlug benchmark summary)
Consider a candidate applying from a phone during a lunch break. They've already decided the role might fit, tapped “Apply,” and entered their name and email. Twenty minutes later, the form still asks for information they've supplied in a résumé, several required fields don't work smoothly on a small screen, and the candidate has to create another login. They close the browser. The ATS records no applicant, but the employer has still lost qualified intent.
That's why raw applicant volume can mislead. A posting may attract substantial traffic while producing few completed applications, and a team that monitors only submitted applications won't see the candidates who abandoned halfway through. The application completion rate definition and calculation makes the hidden loss visible by focusing on candidates who began the process but didn't finish it.
A completion rate helps separate demand from conversion. Job-ad clicks indicate that the title, pay information, location, or sourcing channel generated curiosity. Completed applications indicate that the employer's process sustained enough confidence and convenience for the candidate to submit.
That distinction matters across role types. A complex application may be tolerable for a highly motivated executive candidate, while the same process can eliminate a frontline worker applying from a mobile device. Treating both funnels as identical creates misleading comparisons and encourages teams to optimize the wrong experience.
Operational insight: A candidate who never submits an application is invisible in most recruiting reports, but their abandonment still represents lost recruiting capacity.
The practical cost appears later as an undersized qualified pool, more dependence on outbound sourcing, and pressure to lower screening standards when the requisition remains open. Completion rate gives recruiting operations a starting signal, but it shouldn't be treated as the final measure of hiring success. A funnel can improve at the application stage and still fail because interviews, scheduling, or follow-up move too slowly.
The calculation is straightforward:
Application completion rate = completed applications ÷ started applications × 100
If 240 candidates start an application and 24 submit it, the completion rate is:
24 ÷ 240 × 100 = 10%
The inverse, applicant drop-off rate, measures the candidates who began but didn't finish. In that example, the drop-off rate is 90%, because the candidates who abandoned represent the remainder of the starting group. Neutral definitions from AIHR's application completion rate glossary use this same relationship.
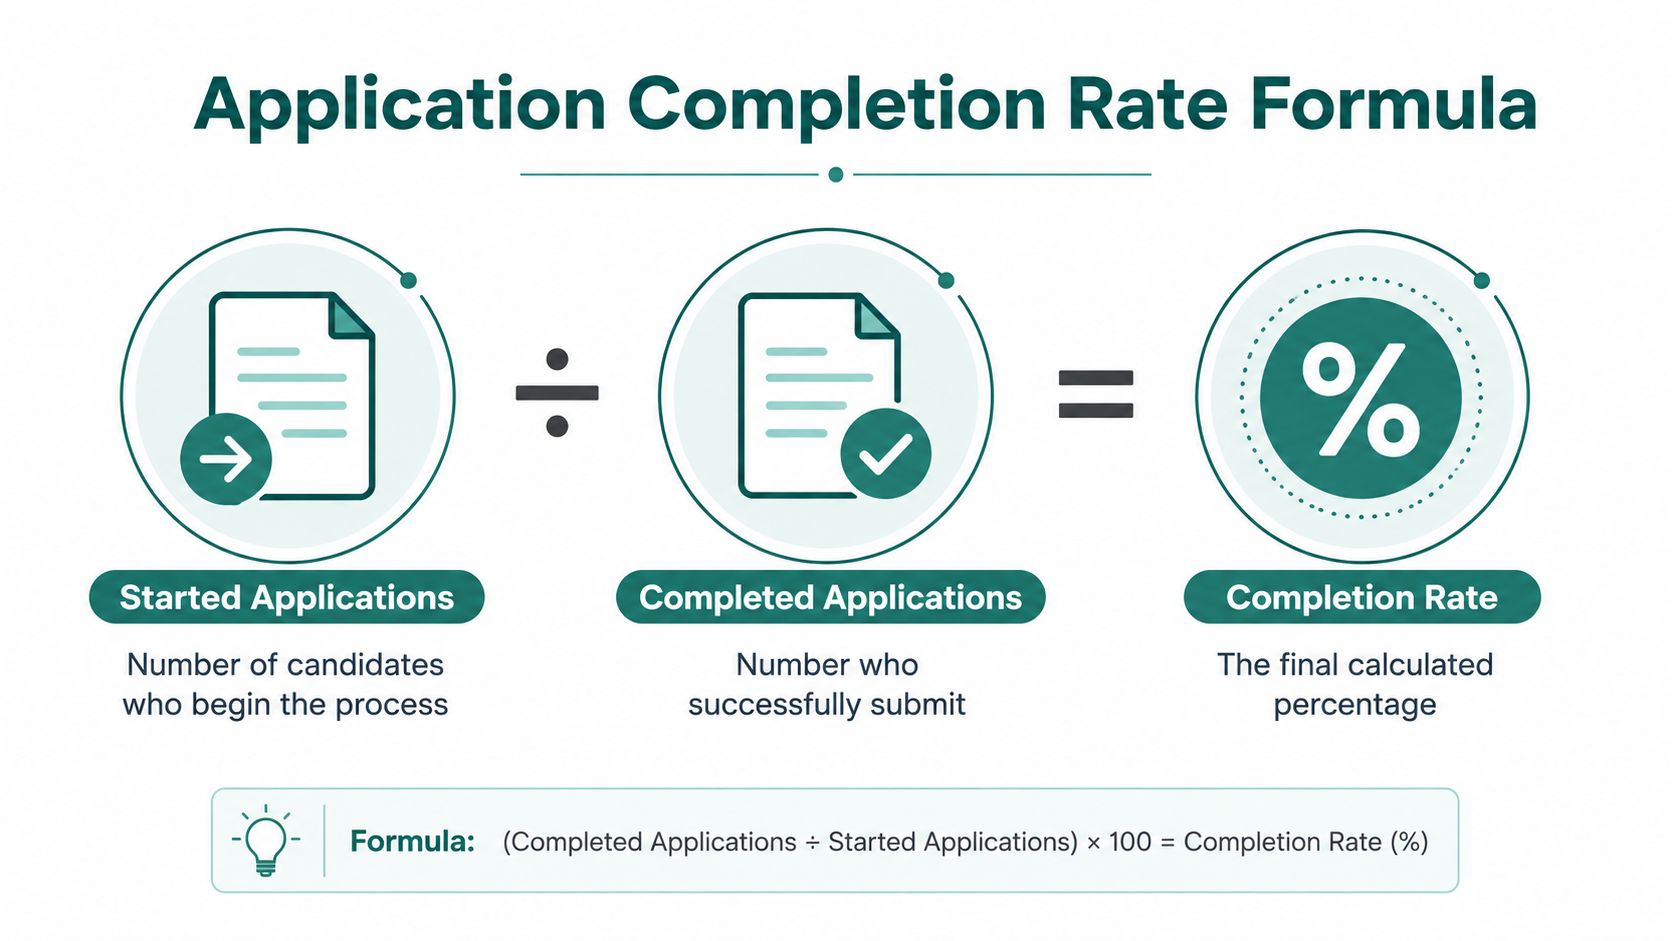
The quality of the metric depends on how the ATS defines “started” and “completed.” A page view shouldn't count as a start, and a candidate who saves a draft shouldn't count as completed. Recruiting teams should establish whether a start occurs when a candidate opens the first form page, enters information, or passes an initial eligibility step.
Use consistent definitions across roles and channels. Otherwise, one requisition may include candidates who merely opened a form while another counts only candidates who entered data. The resulting comparison can look precise while measuring different behaviors.
Completion rate isolates the moment when interest becomes effort. It can reveal whether candidates encounter an obstacle after clicking, such as unnecessary questions, repeated résumé entry, unclear instructions, a forced account, or a form that performs poorly on mobile.
It also belongs beside stage-specific measures, not above them. A candidate experience metrics framework can help teams examine completion alongside other funnel events, including interview progression and response behavior. A strong rate with weak interview attendance points to a different operational problem than a weak rate with rapid downstream movement.
Segment the calculation by role, source, device, location, and application version where the data supports it. An overall number can hide a mobile-specific problem or make a difficult role appear underperforming when its candidate population naturally requires more qualification steps.
A completion rate is useful only when the comparison matches the role, channel, and funnel conditions. A short, mobile-first frontline application should not share a target with a technical or executive process that requires deeper qualification. The benchmark can identify a coordination problem, not just a form problem. A candidate may begin an application willingly, then disappear because the next stage appears slow or uncertain.
Appcast data cited in Pin's recruiting funnel analysis shows a clear relationship between completion time and conversion. Applications finished in under 5 minutes had a 12.47% completion rate, compared with 3.61% for applications taking more than 15 minutes. The analysis also reports an average apply rate of 6.1% across all industries in 2024, based on 379 million job-ad clicks. These figures establish a reference point, not a universal target. They combine applicant intent with the amount of effort employers request.
Question volume provides a second diagnostic. Applications with fewer than 25 questions averaged a 10.6% completion rate, while completion fell substantially when the process took more than 15 minutes, according to Recruitment metrics benchmarks from Built In. A high question count may reflect legitimate screening needs, but it can also signal duplicated data entry or requirements that belong later in the funnel.
Independent recruiting-funnel benchmarks place low-friction frontline roles around 30% to 50%, while high-friction white-collar roles often fall around 10% to 20%. Forms with more than 50 questions can fall to 5.7%, reinforcing the link between survey burden and abandonment, as reported by Role-based completion benchmarks from Metaview.
Use those ranges to form a diagnostic question. A frontline employer with a mobile-friendly process below its expected range should inspect usability and follow-up timing. A professional-services employer near the lower end should separate necessary qualification from repeated information requests. The benchmark becomes valuable when it directs the audit to the stage most likely to be losing candidates.
Mobile behavior requires its own comparison. Cadient's mobile application analysis reports that 65% of job applications are started on mobile, but only 35% are completed on mobile, compared with 48% completion on desktop. That difference can make an overall rate look like weak interest when the actual constraint is interface performance or text-entry effort.
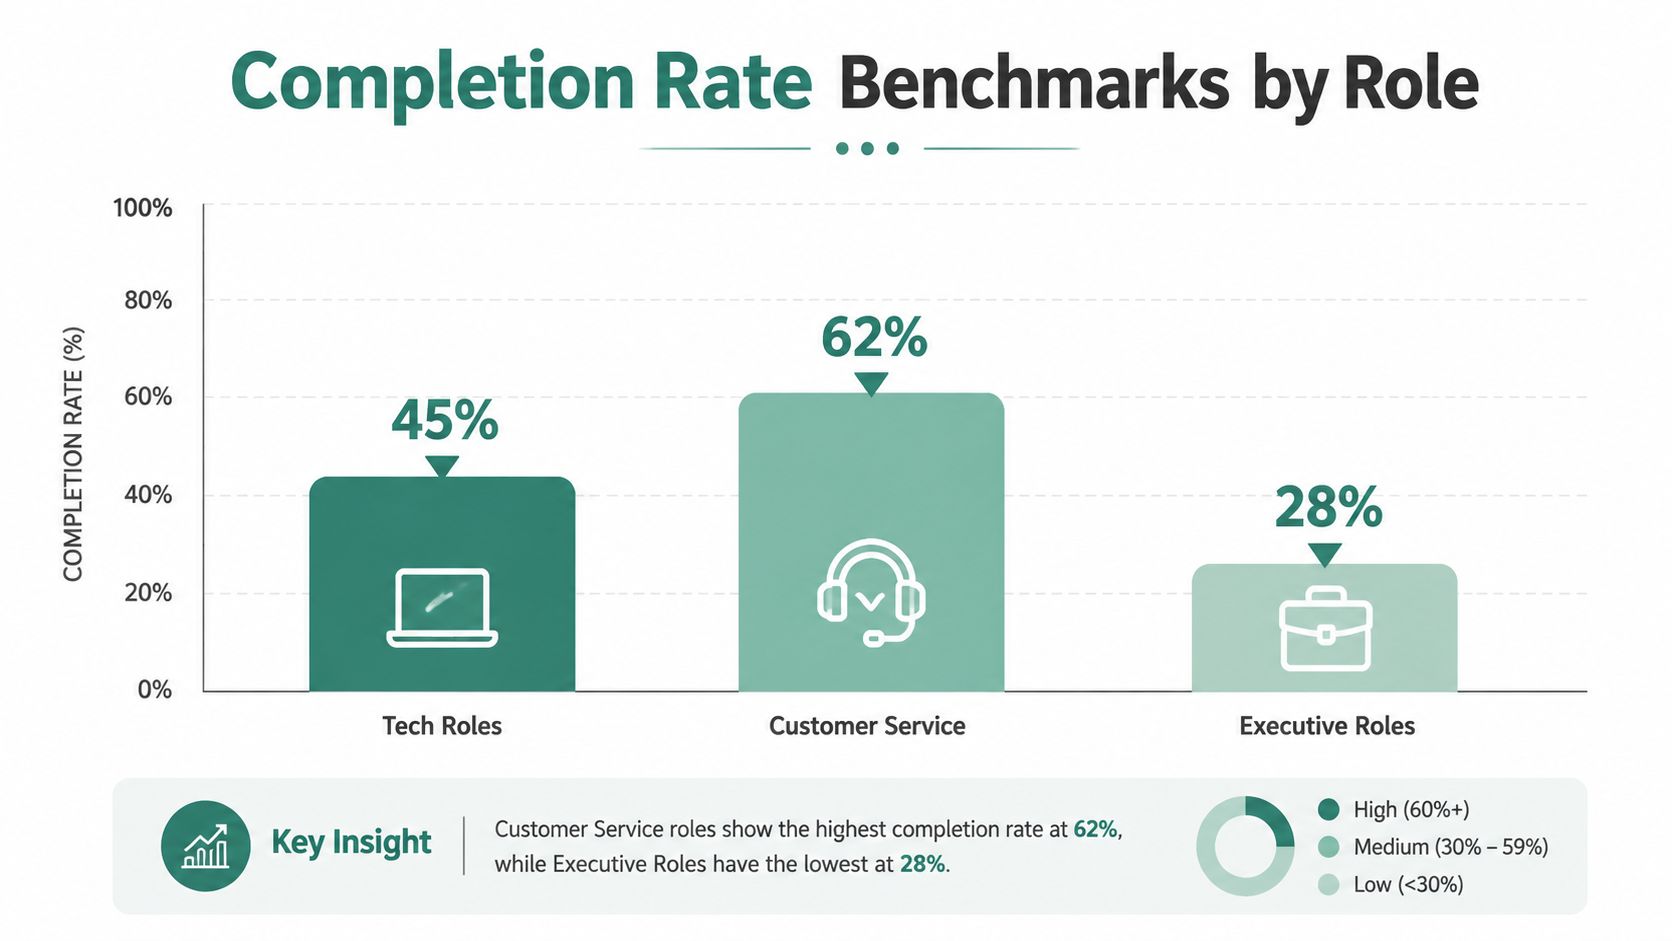
Compare like with like, then review completion time, question count, device mix, role requirements, and the speed of downstream contact. The right benchmark does not promise a result. It shows where the funnel deserves investigation.
The largest hiring leak may occur after the application is submitted. iCIMS 2025 State of Frontline Hiring Report reports that frontline hiring managers see the greatest drop-off at the interview stage, at 32%, followed by scheduling at 20%, onboarding at 18%, and the application stage at 14%.
That ranking changes the audit sequence. Shortening a form can improve completion, yet hiring throughput may remain unchanged if candidates wait too long for an interview invitation or cannot secure a time. The form is visible and easy to edit. The handoffs after submission often require more operational attention.
CareerPlug data cited by Pin indicates that 75% of applicants expect a response within two weeks, while 58% expect one within a week. The median employer response time is 6.7 days, and 28% of candidates stop responding immediately after submitting an application. (Pin's candidate ghosting analysis)
A median response within two weeks does not mean every candidate receives a timely signal. Some applicants submit, receive no clear next step, and continue with another employer before a recruiter reviews the record. The ATS marks the application complete. The candidate experiences a stalled process.
The submission event isn't the end of candidate engagement. It's the point where the employer inherits responsibility for maintaining momentum.
Audit each transition separately: submission to acknowledgement, acknowledgement to review, review to interview invitation, invitation to scheduling, and interview to decision. Compare those intervals with candidate response and attendance records. If candidates disappear after submission, application completion rate alone cannot identify the cause.
These outcomes require different fixes:
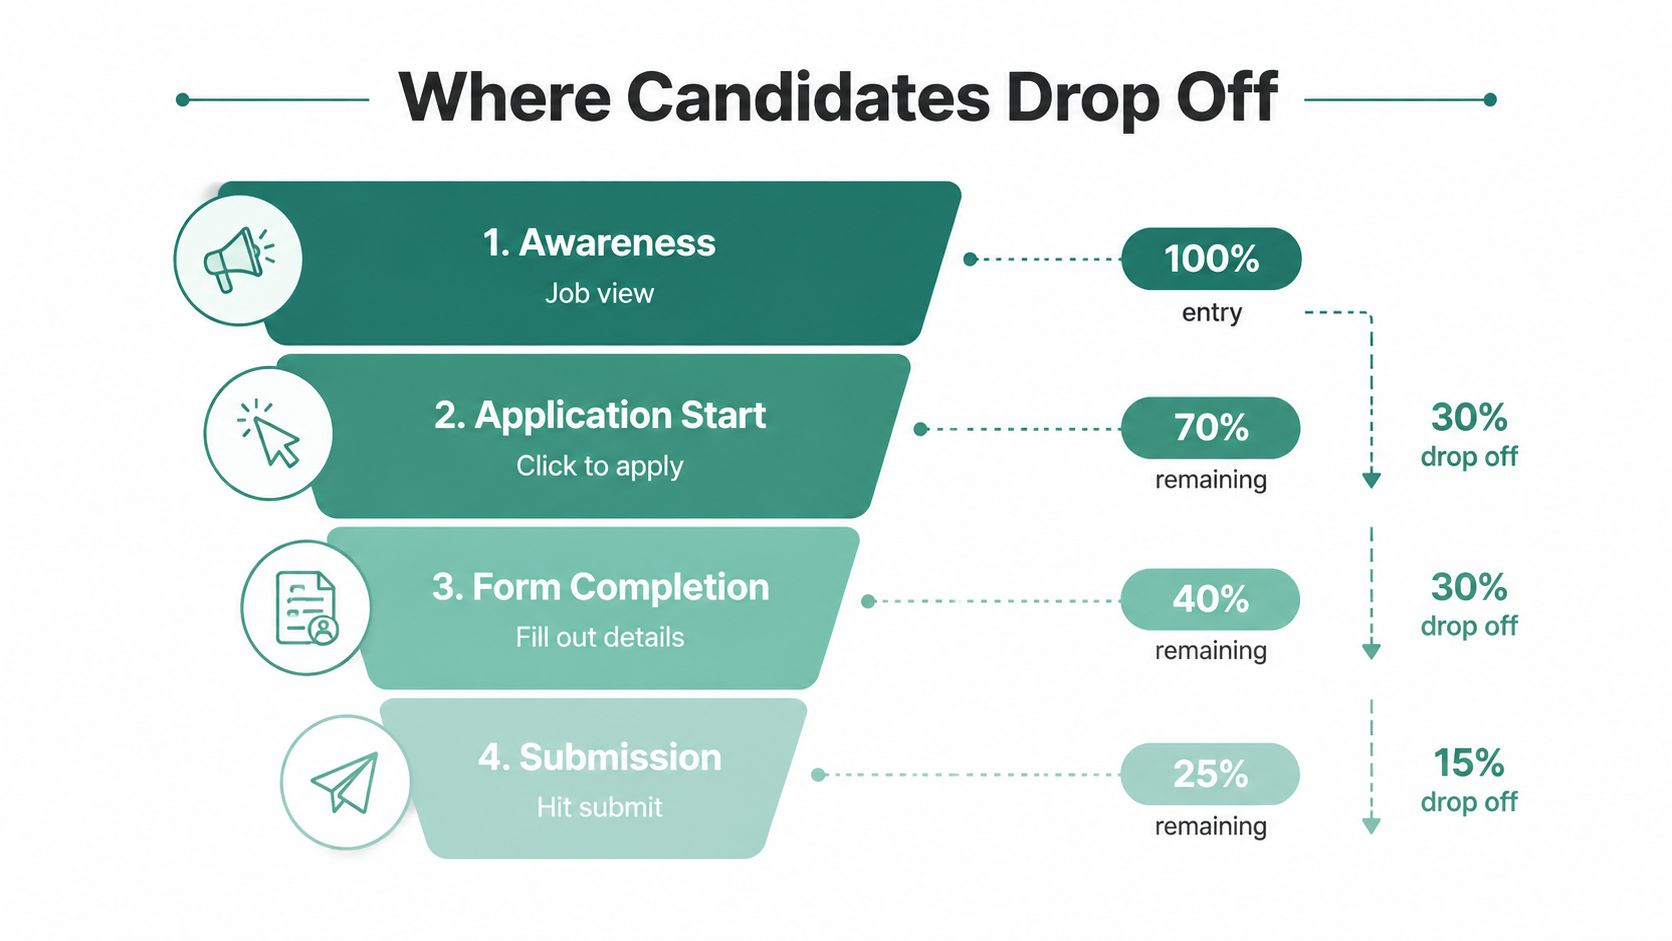
A useful review joins ATS timestamps to interview attendance, scheduling outcomes, and candidate communications. That connection shows whether the next intervention belongs in the form, the mobile experience, scheduling capacity, or internal response process.
The practical diagnosis is role-specific. A high-volume frontline funnel may lose candidates between application and interview, while a professional hiring process may lose them during scheduling or extended review. The completion rate is one signal. Stage-level timing explains whether the application caused the loss or merely recorded a candidate who was already at risk of leaving.
The largest leak should determine the intervention. Form design matters, but completion gains can disappear if qualified applicants wait too long after submitting. Treat the funnel as one operating system, then isolate the stage losing the most usable candidates.
Start by reducing avoidable effort in the first interaction:
These changes address the gap between starting and submitting. Mobile performance deserves separate analysis because 65% of applications begin on mobile, while only 35% are completed there, compared with 48% on desktop. As noted earlier, the comparison indicates a device-specific completion problem. If mobile completion trails desktop completion, repairing the phone experience may recover more candidates than adding another sourcing channel.
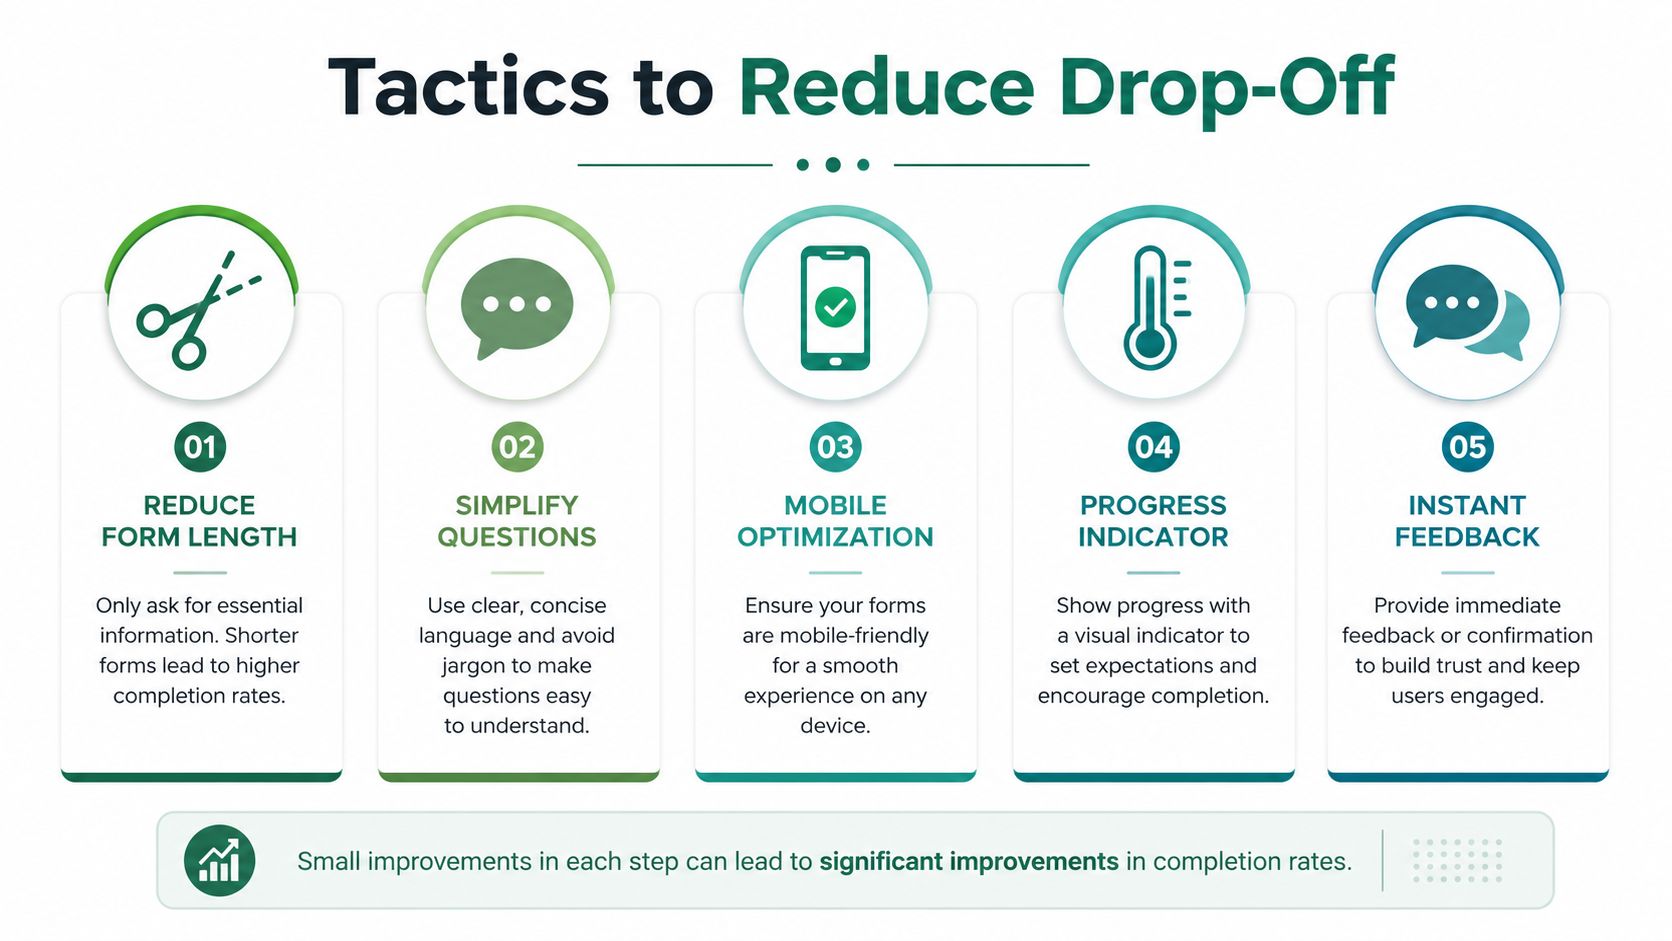
Submission is not the end of the conversion problem. Acknowledgements, status expectations, and rapid routing should be designed as part of the application experience. If candidates receive no clear signal after applying, a completed form can still become a lost hire.
For frontline and high-volume hiring, publish compensation information, clarify required qualifications, and make scheduling simple. Candidates need enough detail to decide whether the role fits before investing more time. Professional or regulated roles may require additional screening, so removing every question is not the objective. The objective is to remove effort that does not improve selection.
A practical reduce bounce rate guide offers broader principles for reducing digital abandonment. Recruiting teams still need role-specific funnel data, since a customer-service process may fail during scheduling while a regulated healthcare process may fail during required screening.
Count candidates lost at each stage and estimate which intervention can recover the largest usable pool. A sharp decline before submission points to form or device friction. A decline after submission points to communication, review, or scheduling capacity. Candidates who stop responding require faster engagement, not another form redesign.
This diagnosis also supports industry-aware decisions. High-volume hiring may need shorter handoffs and immediate scheduling, while professional hiring may benefit more from clearer review timelines. Application completion rate records one stage. Funnel timing shows whether the form caused the loss or merely exposed a broader coordination failure.
Conversational screening changes the early funnel from a waiting line into an information exchange. Candidates can clarify the role while employers collect structured evidence before allocating interview time. A role-aware workflow can cover behavioral, technical, cultural, and compliance topics, then provide an immediate next step instead of leaving applicants in a silent queue.
That timing matters because completion is not the only failure point. Candidates may submit an application and still disappear while waiting for review, clarification, or scheduling. Conversational screening can expose whether the bottleneck is form effort or the handoff that follows it.
Talent Pronto's virtual assistant, Anna, conducts conversational screening and produces structured, comparable scorecards. Employers define the criteria and retain advancement and rejection decisions. The system supports consistent early evaluation, reducing dependence on résumé triage alone.
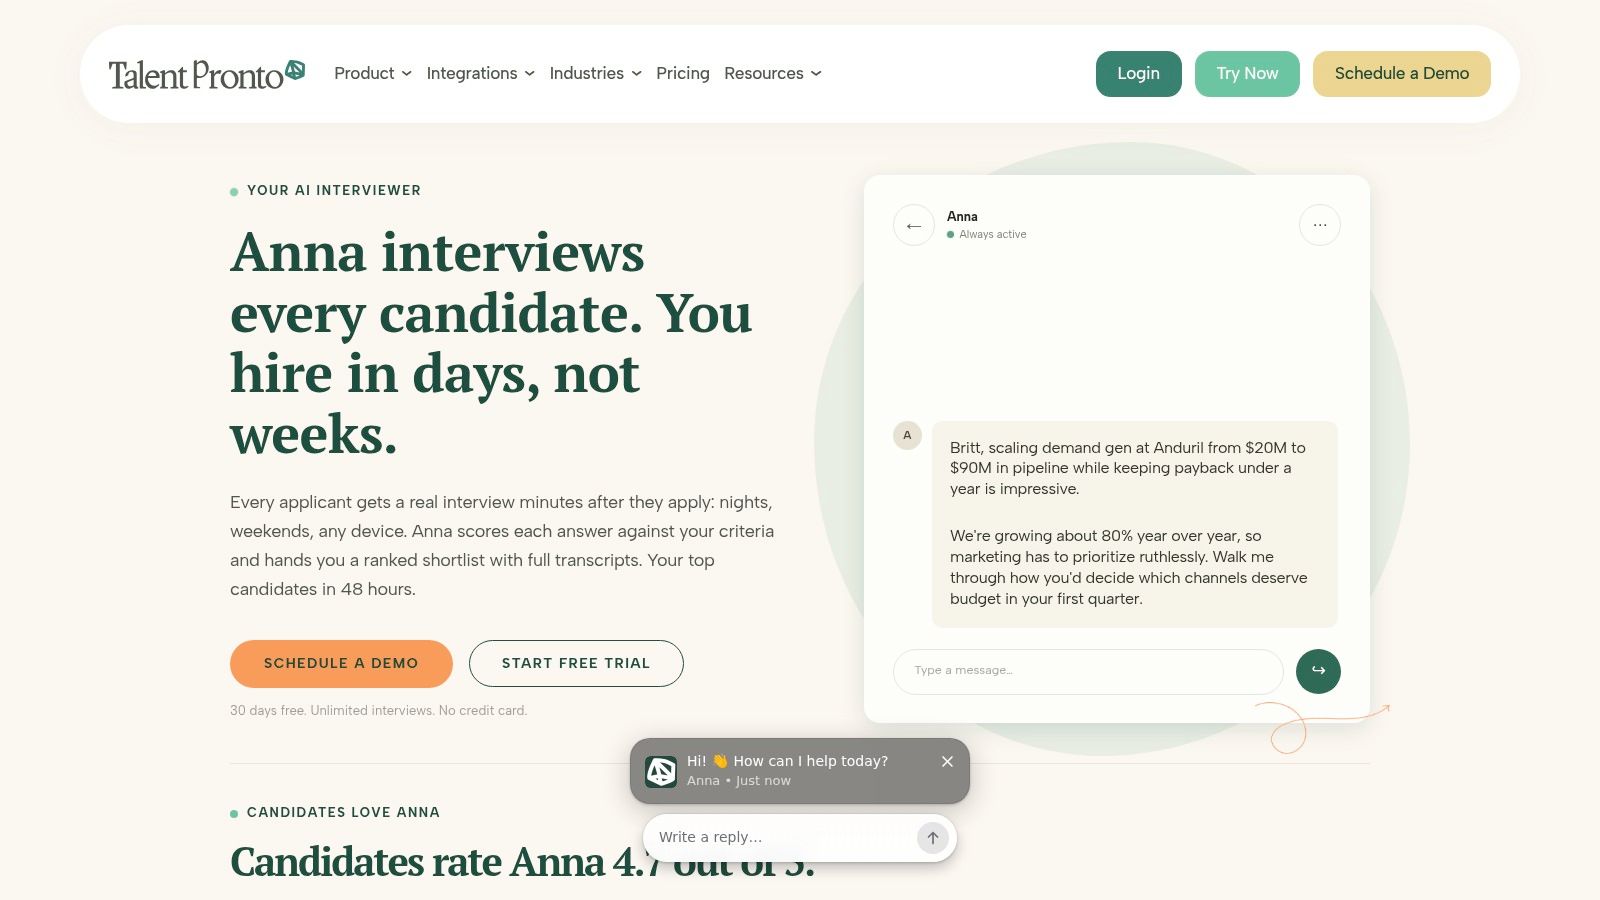
The value extends beyond collecting answers. A conversational layer can respond at any hour, answer questions about compensation, benefits, and culture from employer-provided information, and direct qualified candidates toward scheduling. These actions address three recurring sources of funnel loss: application burden, delayed communication, and inconsistent early assessment.
It also accommodates different submission preferences. Candidates can opt out in favor of a traditional application pathway, allowing employers to introduce conversational screening without making it the only route.
Leaders evaluating adoption can consult this AI hiring guide for CXOs for context on AI agents in recruiting operations. The operational test is specific: does the workflow improve candidate responsiveness, preserve structured evaluation, and give recruiters usable evidence before manual review becomes a delay?
A screening layer creates value only when its data enters the hiring workflow. Talent Pronto integrates with Greenhouse, iCIMS, Paylocity, ADP, and Workday, syncing candidate data and statuses to reduce duplicate entry. Its published product information states a typical implementation timeline of one to three weeks.
Teams should define question governance, scorecard consistency, candidate communications, opt-out handling, and ownership of final decisions before deployment. Talent Pronto's chatbot for recruitment resource provides more information about the workflow.
The strongest use case is coordinating early engagement, evaluation, and next-step movement. If candidates submit but wait too long for human review, improving the form alone will not repair the funnel. Conversational screening earns its place when it keeps qualified applicants progressing after initial interest.
Application completion rate is a diagnostic signal, not a hiring outcome. It measures movement from started to submitted applications, while leaving unanswered whether recruiters respond promptly, interviews get scheduled, or qualified candidates reach a decision.
Build the scorecard around three checks:
The remedy should match the failing stage. Reduce question burden when the form creates friction. Improve mobile usability when device-level abandonment is higher. Speed up response and scheduling when candidates submit successfully but then stop progressing. HR data analytics guidance can help teams connect these measures in a repeatable scorecard.
Completion gains matter only when downstream operations can absorb additional applicants. A stronger scorecard therefore pairs submission data with response time, scheduling movement, and progression by role and source.
Talent Pronto provides conversational screening, role-specific questions, structured scorecards, and next-step coordination across common ATS and HRIS platforms. Visit Talent Pronto to assess whether a 24/7 screening workflow can improve completion while identifying where candidates leave the funnel.

Talent Pronto is an AI-powered hiring platform built around Anna, our intelligent AI that conducts 24/7 conversational screening, evaluates candidates against specific job requirements and compliance needs, and schedules interviews. Run everything on the Talent Pronto ATS, our all-in-one applicant tracking system with a branded careers site and Anna built in, or keep your existing ATS and let Anna integrate with Greenhouse, Ashby, iCIMS, Jobvite, Lever, Oracle, and more. Either way, we help organizations reduce time-to-hire and build stronger teams.