Master data analytics in human resources with this practical guide. Learn key metrics, steps, and how AI screening drives hiring outcomes.
You've got the dashboard open, the ATS export in one tab, payroll in another, engagement survey results in a third, and a leader asking for a retention answer by tomorrow morning. The data is there, but it's scattered, inconsistent, and already a few weeks old by the time anyone agrees on which version is “right.” That's the starting point for data analytics in human resources, not a shiny platform demo, but the daily grind of turning fragmented people data into decisions you can defend.
The strongest HR teams don't treat analytics as a reporting exercise. They treat it as a governance problem first, then a decision system. Once definitions are standard, source systems are connected, and the right metrics are limited to what matters, HR can move from reactive explanations to credible workforce planning.
A typical HR leader doesn't lack data. They lack a clean way to answer the question that matters. One week it's hiring effectiveness, the next it's regretted attrition, and the answer still ends up in a spreadsheet that someone manually stitched together from the ATS, the HRIS, payroll, and a survey export.
That pattern is exactly why data analytics in human resources matters. The old model was descriptive reporting, headcount, turnover, maybe time-to-fill. Useful, yes, but not enough when executives want to know what's likely to happen next and what action makes sense now. Practitioner guidance now recommends starting with only 3 to 5 core metrics before scaling, because broad dashboards usually create more noise than clarity, while the analytics maturity model moves from descriptive analytics to predictive analytics and then prescriptive analytics as summarized in HR Acuity's guidance.
The shift is not technical, it's managerial. HR stops asking, “What happened?” and starts answering, “What should we do about it?” That difference changes how leaders think about retention, hiring, engagement, and workforce planning, especially in distributed organizations where regional data often looks comparable on paper but means something different in practice.
Practical rule: if a metric can't be explained to a line manager in one sentence, it's probably too early to put it on an executive dashboard.
HR analytics becomes useful when the team stops chasing every available data point and narrows in on decisions. If leadership is trying to reduce attrition in critical roles, the first job is not to build a beautiful dashboard. The first job is to identify the few measures that can reliably point to risk, then make those measures consistent enough to trust.
The most useful way to think about HR analytics is as a ladder, not a menu. Each layer answers a different question, and each depends on the layer below it being stable. That's why weak reporting usually fails the moment people try to use it for forecasting.
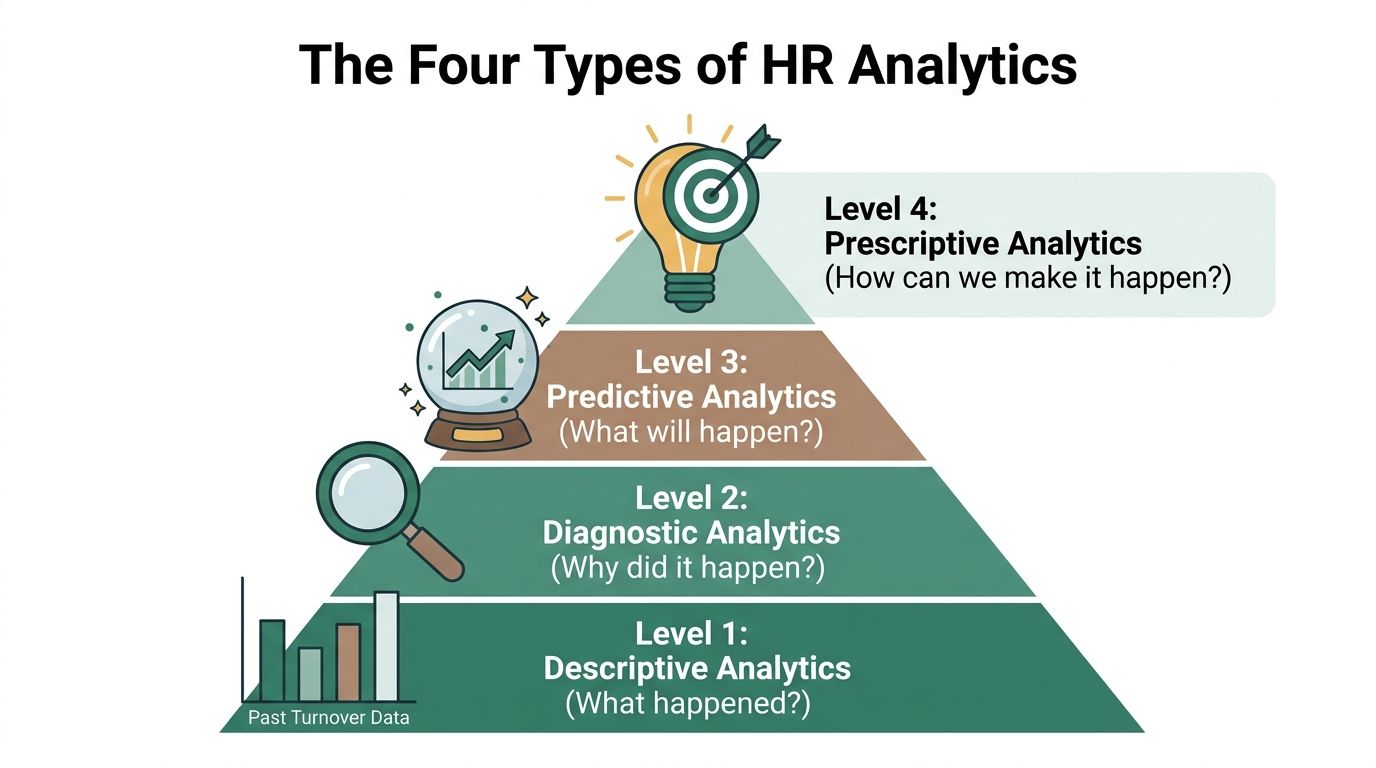
Descriptive analytics is the baseline. It tells you what occurred in the workforce, such as turnover in a given business unit, average time-to-fill, or training completion trends. If the numbers are wrong or incomplete, everything above this layer starts to wobble.
For HR teams, most dashboards should begin here. A useful descriptive report doesn't try to impress people with complexity. It gives a stable view of the workforce so managers can see the facts without asking three analysts to reconcile the same metric.
Diagnostic analytics moves from counting to explaining. When turnover spikes in one function, the core question is whether the issue traces back to manager changes, workload, location, or a bad hiring pattern. The point is to isolate drivers, not just name the result.
Source system quality starts to matter more than the dashboard design. If job titles differ across regions or turnover means one thing in the ATS and another in the HRIS, the explanation will be shaky even if the chart looks polished.
Predictive analytics uses historical data to estimate future outcomes. In hiring, that can mean ranking applicants against role criteria, or identifying which employees may be at higher risk of leaving. SHRM notes that data analytics can help HR classify applicants by predicted high or low performance or collaboration potential, while AI-enabled HR analytics platforms use machine learning and NLP to detect patterns and automate alerts according to SHRM.
That kind of model is only defensible when it supports human judgment rather than replacing it. Clean labels, consistent rubrics, and review by trained recruiters matter more than the sophistication of the model alone.
Prescriptive analytics answers the question leaders care about, what action should happen next. If a group of high-performing employees looks at risk, the output should not be a generic alert. It should guide a retention intervention, a manager coaching conversation, or a workload change.
A good rule is simple, descriptive shows the fact, diagnostic shows the cause, predictive flags the risk, and prescriptive ties the risk to an action. When an HR team tries to jump straight to prescriptive recommendations without trustworthy descriptive data, the result is usually theater, not insight.
Structured analytics only helps when the organization is willing to act on the answer. Otherwise, it becomes a prettier version of the same old spreadsheet.
For a broader primer on people analytics concepts, the Talent Pronto overview of people analytics is a useful companion read.
The fastest way to lose trust in HR analytics is to measure too much. A crowded dashboard looks impressive until nobody can tell which metric should drive a decision. Better programs narrow the lens to the few indicators that align with the business's actual people problems.
Recruitment teams usually need a mix of time-to-fill, source effectiveness, offer acceptance, and quality-of-hire. Retention teams care more about voluntary turnover by segment, engagement trends, and internal mobility. Performance teams need distribution patterns, promotion velocity, and the relationship between training completion and output. DEI work usually depends on pipeline representation, pay equity, and movement through each stage of hiring and advancement.
Those metrics come from different systems. HRIS data provides the employee backbone, ATS data captures applicant flow, payroll helps validate movement and cost, surveys show sentiment, performance systems reveal progression, and learning systems document training completion. In a mature setup, those sources don't live in separate silos. They feed one decision layer with consistent definitions.
| Category | Key Metrics | Primary Data Sources | Business Questions Answered |
|---|---|---|---|
| Recruitment | Time-to-fill, source effectiveness, offer acceptance, quality-of-hire | ATS, HRIS, interview scorecards | Which channels and roles move efficiently, and which produce strong hires? |
| Retention and Engagement | Voluntary turnover by segment, engagement trends, internal mobility | HRIS, surveys, payroll | Where is attrition concentrated, and what employee groups are most exposed? |
| Performance and Productivity | Performance distribution, promotion velocity, training completion | Performance tools, LMS, HRIS | Are employees progressing, and does development connect to performance? |
| Diversity and Inclusion | Pipeline representation, pay equity analysis, representation trends | ATS, HRIS, payroll, surveys | Where do candidates or employees drop out, and are outcomes consistent? |
The best programs start with 3 to 5 core metrics tied to the biggest workforce challenge, not every question HR could possibly answer. In healthcare, that may mean turnover in critical roles and hiring velocity. In a tech startup, it may be candidate quality and retention in engineering teams. Context matters more than dashboard breadth.
For a practical look at system connection points, the Talent Pronto guide to HRIS integration is relevant because source alignment is where many analytics projects either stabilize or fail.
The hardest part of HR analytics is rarely model design. It's data cleanup, definition control, and governance across systems that were never built to speak the same language. If the ATS, HRIS, payroll, and survey tools all define “turnover,” “manager,” or “high-performer” differently, your dashboard can look precise while telling the wrong story.
This problem shows up fast in real organizations. Job titles vary by region, duplicate candidate records stay open in the ATS, performance ratings use different scales across functions, and missing values create holes in the analysis. A study indexed on PubMed found that use of HR data and analytics was restricted by poor software systems and data, alongside social rigidities, hierarchical structures, and detailed recruitment and hiring policies as documented in the study.
The mechanics matter. Data cleaning in HR analytics usually includes handling missing values, removing duplicate entries, and standardizing formats, units, and scales. One practical example is making sure “10%” and “0.10” are treated identically before analysis, because inconsistent formatting can distort results even when the underlying data is valid as noted in Cambridge Spark's HR data cleaning guidance.
SHRM's executive guidance emphasizes a strong data foundation, centralized sources, clean and complete data, and standardized definitions for terms like turnover and high-performer, while Korn Ferry has pointed to the trouble that appears when organizations lack integrated people data and a shared talent language in its CHRO guidance. Those are not cosmetic issues. They determine whether comparisons across regions, managers, or job families are valid.
Rule of thumb: if two HRBPs can't define the same metric the same way, the organization does not yet have an analytics problem. It has a governance problem.
The most effective audit starts with the measures that leaders already use in meetings. Check definitions, duplicate handling, date logic, and source ownership first. Then identify where workflows differ by region or function, because inconsistent job architecture is often the hidden reason an advanced dashboard produces misleading conclusions.
A realistic HR analytics program is phased. Organizations that try to solve everything at once usually end up with expensive software, low adoption, and reports no one trusts. The better path is to build the foundation, prove one use case, and then expand only after the data and governance are stable.
Start by auditing the systems that already hold people data. Map where the HRIS, ATS, payroll, survey tools, performance platform, and learning data live, then decide which fields are authoritative for each metric. The goal is not perfection, it's a clean enough baseline to support the first reporting cycle.
That's also the phase where you fix the most damaging inconsistencies. Standardize definitions, remove duplicate records, and agree on who owns each metric. If leadership wants attrition insight, for example, everyone needs the same turnover logic before the first chart gets shown in a meeting.
Once the data is stable, build regular dashboards for the few metrics that matter most. Put them on a cadence that managers can use effectively, not a cadence that only satisfies a quarterly reporting cycle. The point is to create a habit of review.
A useful dashboard doesn't need to be exhaustive. It needs to be repeatable, readable, and tied to decisions. That is also where many teams get value from tools like conversational hiring platforms that create structured candidate records, because consistent upstream inputs make later analytics less fragile. One example is Eztrackr's AI hiring insights, which is worth reading as a contrast point for teams thinking about screening data quality.
Only after the basics are reliable should the team move into root-cause analysis and forecasting. At that point, it becomes meaningful to ask why a pattern appears and which employees, roles, or teams may be at risk next. If the underlying data isn't clean, predictive work just magnifies the noise.
A small pilot is usually enough to prove value. Pick one business question, one audience, and one workflow, then document the result in plain language. Executive sponsorship matters here, but so does analytics literacy among HRBPs and recruiters, because tools don't get adopted just because they exist.
The final phase is not more dashboards, it's more decision-making discipline. Analytics should show up in workforce planning, hiring reviews, manager coaching, and retention interventions. That only happens when the process is part of the operating rhythm, not an extra report people check if they remember.
A hiring review can fall apart fast when someone asks who can see candidate data, how long it stays in the system, or whether a manager used it the same way across teams. Those questions are not side issues. Workforce data is sensitive, and fragmented systems, inconsistent definitions, and loose access controls can make a polished dashboard look trustworthy when the underlying inputs are anything but.
A 2021 review in the International Journal of Human Resource Management warned about the dark sides of people analytics, especially in recruitment, performance evaluation, and retention management in the journal review. That concern shows up in practice when teams automate screening or risk scoring before they have cleaned up job codes, status fields, and evaluation rubrics. Advanced tooling cannot compensate for inconsistent data definitions or a patchwork of systems that record the same employee differently.
The safer approach is structured analytics with human oversight. Use data to surface patterns, rank candidates, or flag retention risk, but keep the final decision with a person who can check context, exceptions, and fairness. That also creates a place to document review steps and explain why a recommendation was accepted or rejected.
Employees and candidates should know what data is being collected, why it is being used, who can access it, and how long it will be retained. SHRM's guidance on the risks and rewards of data analytics makes the same basic point about consent, bias mitigation, and clear limits on data use in HR programs in its risk and rewards coverage. If an HR team cannot explain the workflow in plain language, the process is not ready for broad use.
The test is whether the organization can reconstruct a decision after the fact. If a candidate or employee challenges an outcome, leaders should be able to point to the rubric, the data sources, the review path, and any manual override. For teams building fairer hiring systems, the Talent Pronto equal opportunity hiring article fits into the same governance conversation because it focuses on how hiring decisions can be structured more consistently.
Fairness in analytics comes from consistency, auditability, and human review, not from pretending the model has no bias risk.
Analytics only matters when someone changes a decision because of it. Otherwise, the organization has bought a reporting habit, not an operating advantage. The strongest HR teams use data to shift manager behavior, focus recruiting effort, and target retention interventions where they'll matter.
In hiring, structured candidate data can make comparisons more consistent across applicants. That's especially useful when screening outputs are tied to role criteria and every candidate is scored using the same rubric. Talent Pronto's platform, for example, supports conversational screening, structured scorecards, and integrations with ATS and HRIS tools, which can help create cleaner input data for later reporting. It's one option among several, but the value here is the same, standardized early-stage data makes analysis more usable.
In workforce planning, the business outcome is often not the dashboard itself, but the decision it triggers. If turnover is clustered in one unit, leaders can coach managers, adjust workloads, or change hiring strategy. If one sourcing channel consistently produces stronger hires, recruiting can shift effort toward that channel instead of chasing volume everywhere.
Executives rarely want a technical explanation of model fit. They want to know whether the plan reduces risk, improves hiring quality, or strengthens retention in critical roles. The more directly HR can connect data to those outcomes, the easier it becomes to secure budget and sponsorship.
A good analytics culture also changes how meetings run. Leaders stop asking for anecdotes first and start asking for the underlying trend, the source of the data, and the action attached to it. That's a small shift, but it changes the quality of every workforce conversation.
The payoff is not just cleaner reporting. It's a HR function that can explain what's happening, why it's happening, and what to do next without relying on guesswork. If your team is trying to build that kind of discipline, start by fixing the data foundation, then choose one high-value use case and make it repeatable.
Talent Pronto helps teams create structured screening data that's easier to compare, review, and analyze across candidates. If you're working on cleaner hiring analytics, fairer scorecards, and better early-stage decision-making, visit Talent Pronto to see how conversational screening and standardized evaluations can support that work.

Talent Pronto is an AI-powered hiring platform built around Anna, our intelligent AI that conducts 24/7 conversational screening, evaluates candidates against specific job requirements and compliance needs, and schedules interviews. Run everything on the Talent Pronto ATS, our all-in-one applicant tracking system with a branded careers site and Anna built in, or keep your existing ATS and let Anna integrate with Greenhouse, Ashby, iCIMS, Jobvite, Lever, Oracle, and more. Either way, we help organizations reduce time-to-hire and build stronger teams.