Learn which candidate experience metrics matter, how to measure them, and how automation improves application completion, drop-off, and time-to-hire.
The strongest candidate-experience benchmark isn't a sentiment score, it's application completion rate. LinkedIn's benchmark data puts it at 34%, with average time to hire at 38 days and average candidate NPS at 11 and CSAT at 3.8/5 from Talent Board referenced in LinkedIn's materials, which means hiring teams are losing volume long before a recruiter reviews a resume and then keeping candidates waiting for more than a month before the process resolves. That's why candidate experience metrics belong in operations, not just employer branding, because they expose where the hiring funnel leaks, slows, and repels applicants.
If you've ever watched a high-volume requisition fill with qualified starts but very few completed applications, you already know the problem isn't always sourcing. It's friction, delay, and inconsistency. A good measurement system shows which of those is happening, where it happens, and what changed after a process fix.
Application completion rate is the strongest candidate-experience benchmark, and it changes how hiring teams read the rest of the funnel. LinkedIn's benchmark data, based on Talent Board-referenced figures, also shows average candidate NPS of 11, CSAT of 3.8/5, and time to hire of 38 days (LinkedIn candidate-experience metrics benchmark). Taken together, those figures point to a simple reality, many applicants start the process and never finish it, while hiring cycles can stretch long enough for strong candidates to lose interest or accept another offer.
Practical rule: If most starts never become completed applications, the issue is usually friction, delay, and inconsistency in the funnel.
That is why candidate experience cannot live only in a quarterly survey deck. It works best as an operating system for recruiting, one that connects candidate sentiment to funnel mechanics, speed, and downstream outcomes like offer acceptance and quality of hire. Teams that track only a satisfaction score often learn about pain after candidates have already dropped out. Teams that watch the full system can spot where the process is breaking before it turns into a missed hire.
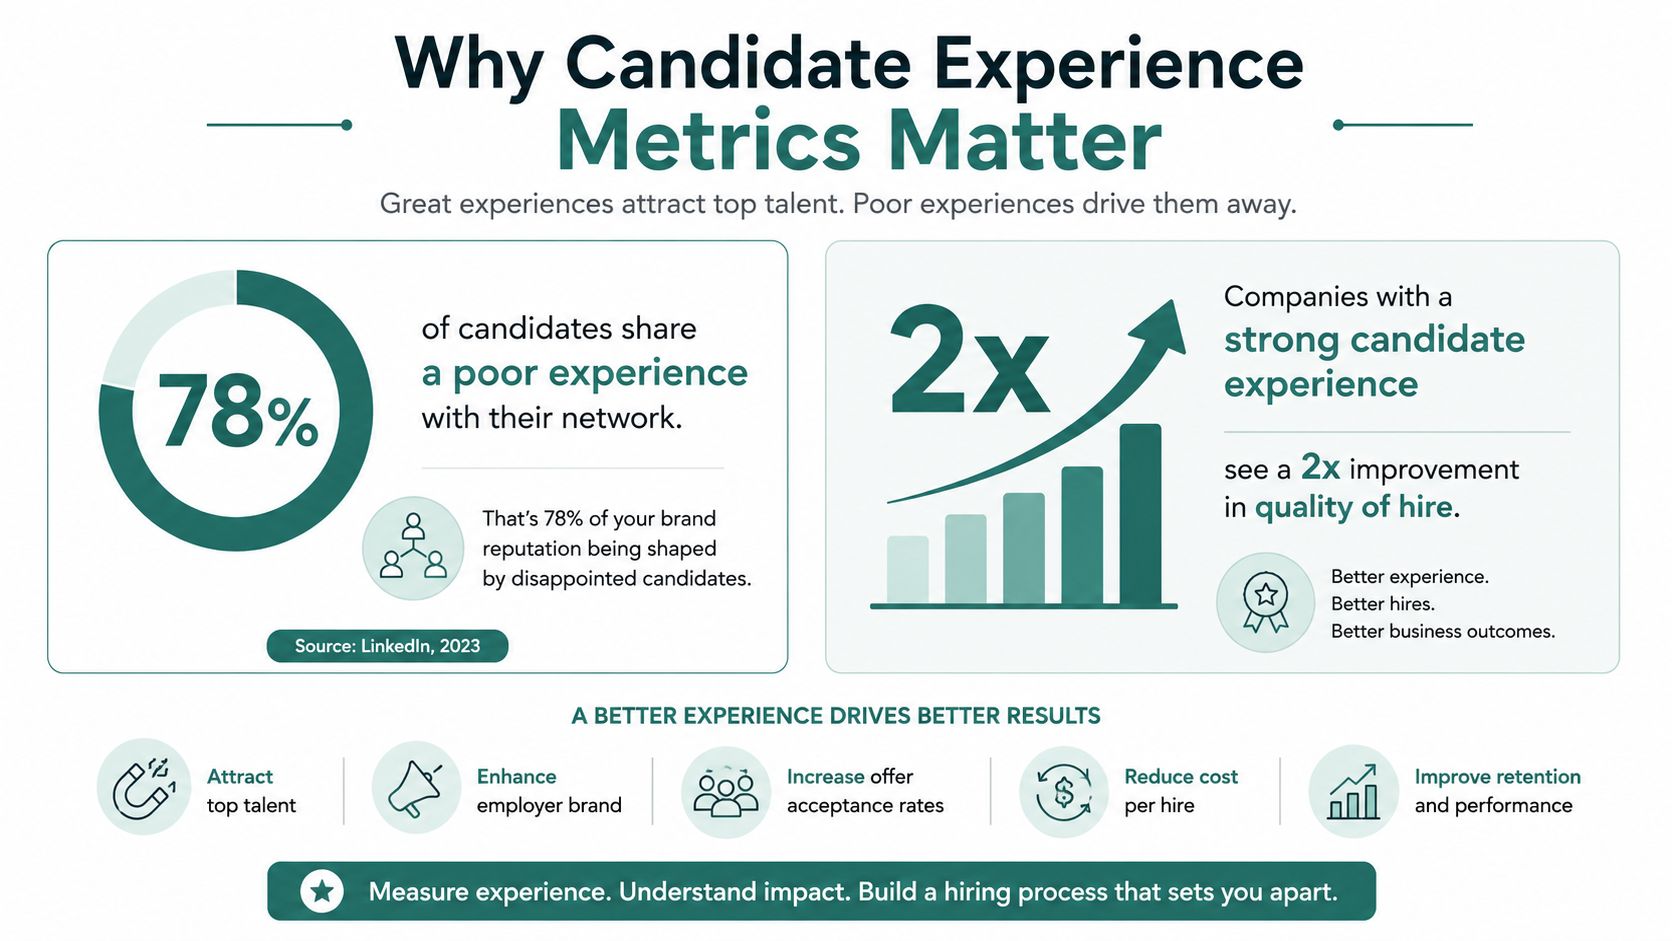
The business case reaches beyond recruiter convenience. A poor experience gets talked about, and a strong one protects the brand that future applicants will assess before they click apply. For a practical hiring lens that complements this, the guide from Benely on hiring offers a useful external view on attraction tactics, while the analytics work belongs inside your own dashboards and review cadence.
For teams building that measurement discipline, the framework in this people analytics guide is the right starting point. Candidate experience metrics only matter when they inform decisions, not when they sit as a decorative scorecard.
The shift happens when you stop asking whether candidates liked the process and start asking where they dropped, how quickly they moved, and whether the process behaved differently across roles. That diagnostic view turns candidate experience metrics into a management tool, and it also shows where 24/7 conversational screening or structured rubrics can move each KPI.
Candidate experience metrics work best when they're grouped into a few families instead of scattered across a dashboard. The practical split is funnel metrics, sentiment metrics, speed metrics, and fairness metrics. Each family answers a different question, and each can mislead you if you try to make it do the work of the others.
The most visible funnel measures are application completion rate and stage-specific drop rate. Completion rate is simple, completed applications divided by started applications. Stage drop rate tells you where people disappear, whether that's after the form, before the interview, or after a long delay between steps. These are leading indicators, because they show friction while it's still happening.
A high completion rate can still be bad if the form filters out qualified people for the wrong reasons. A low drop rate can still hide a poor process if the only people finishing are the ones with unusually high intent. That's why funnel metrics need context, not celebration.
Candidate NPS and CSAT are the classic experience measures. They matter because they capture whether candidates would recommend the process or rate it positively, but they're lagging indicators. They tell you what candidates thought after the fact, not what caused the thought.
Practical rule: Use sentiment to confirm a pattern, not to discover it.
Time to hire, time per stage, and median scheduling delay tell you how long the process takes from the candidate's point of view. The Candidate Experience Institute recommends tracking the share of applicants who reach first interview within a fixed time window, and pairing that with scheduling delay to isolate recruiter latency, calendar coordination, or manual review bottlenecks (Candidate Experience Institute metric framework). In practice, speed metrics are often the most actionable because they point to a specific operational fix.
Fairness is harder to quantify, but it matters because inconsistency damages trust. Interview-to-offer ratio, structured-rubric adherence, and progression patterns by interviewer or requisition group help reveal whether candidates are being evaluated on a repeatable basis. These measures are especially useful when hiring managers have wide discretion, because discretion without structure creates uneven outcomes.
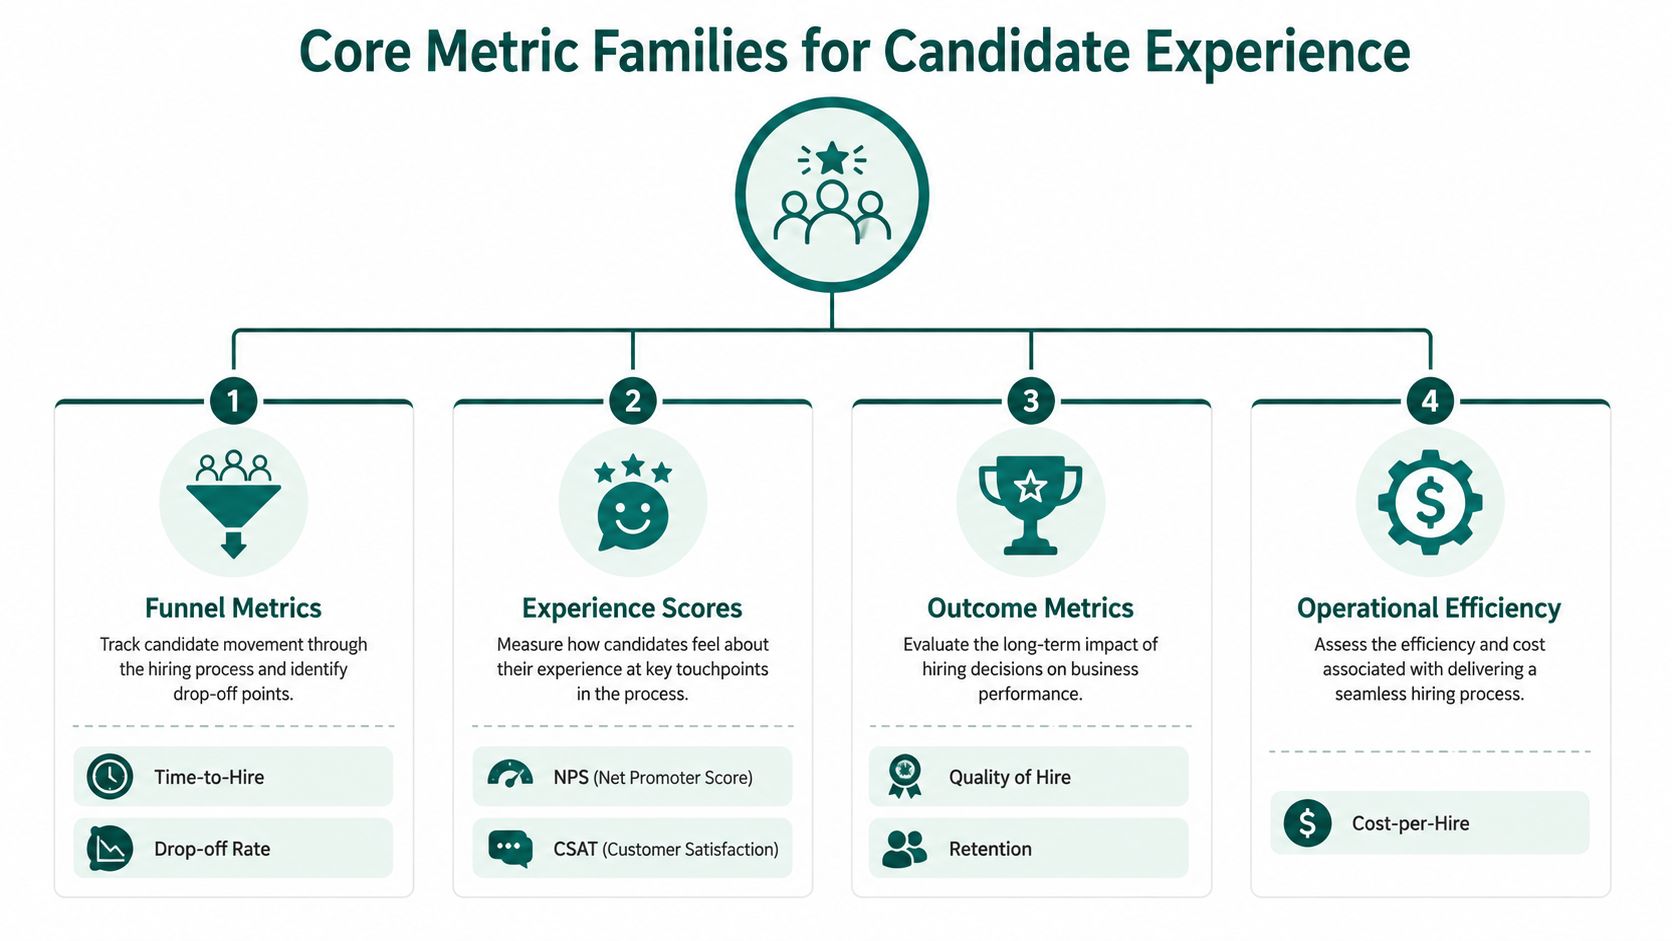
The families work together. Funnel data shows where people fall out, sentiment shows whether they felt the friction, speed shows how long the friction lasted, and fairness shows whether the process was consistent enough to trust. If one family is missing, the dashboard tells a partial story.
Most candidate experience programs fail before the first dashboard gets built, because the data lives in separate systems that don't speak the same language. ATS logs track applications and stage changes, HRIS records show offer and hire outcomes, scheduling tools hold calendar latency, conversational screening platforms capture engagement and completion signals, and post-interview surveys capture sentiment. If those inputs don't share a candidate identity, a stage taxonomy, and a clean timestamp standard, the chart will look precise while telling the wrong story.
The first job is identity matching. Use a single application ID or another stable candidate key across systems so you can follow one person from start to finish. Without that, a candidate can look like three different people, one in the ATS, one in scheduling, and one in survey results.
Recruiting coordinators and hiring managers rarely use the same stage names the same way. One team's “screened” is another team's “qualified,” and that mismatch breaks every downstream comparison. Normalize stage definitions before you compare time-per-stage or drop-off by recruiter, because otherwise the dashboard measures terminology drift instead of process quality.
Time zones also matter more than expected. If a candidate applies late in the evening and a scheduler logs a step the next morning, unaligned timestamps can distort delay metrics. Normalize timestamps to one standard so “time between events” means the same thing in every market.
Keep the candidate's consent in the process. If you use surveys or screening automation, give people a clear way to opt out without losing their application.
For a practical parallel on building clean measurement pipelines in HR, the data analytics in human resources guide is a useful companion read. It reinforces the same point, good analytics starts with clean inputs, not prettier charts.
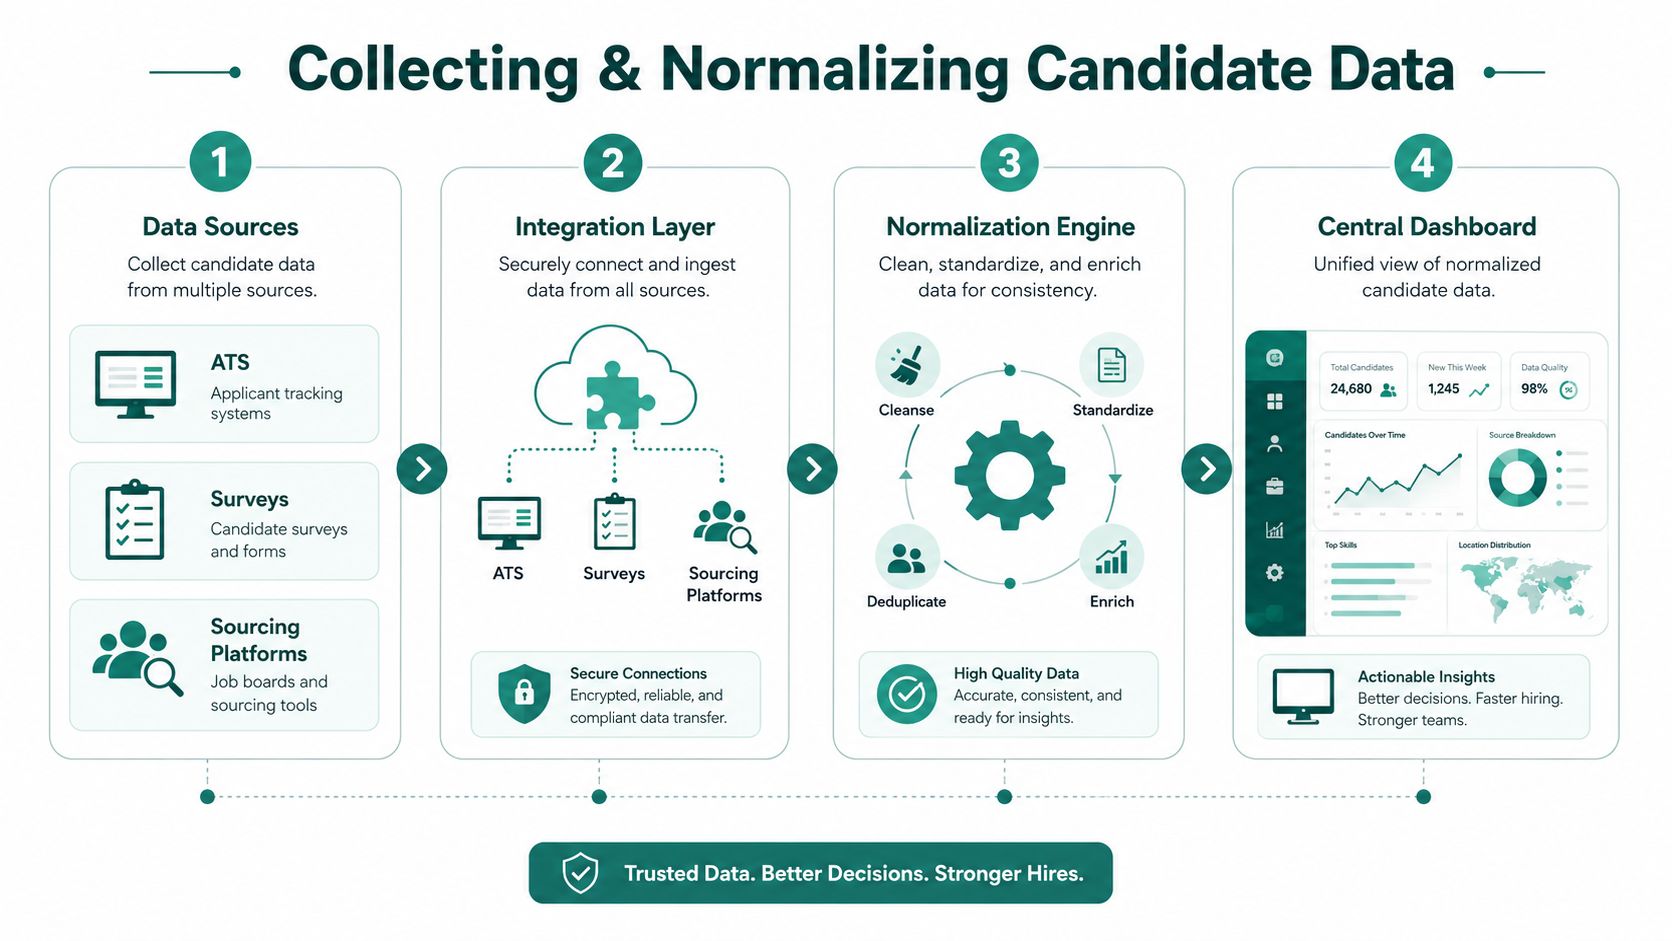
The technical goal isn't just data ingestion, it's trustworthy comparison. That means defining what counts as a started application, what counts as completion, when a stage begins, and what qualifies as a move to the next step. Once those rules are fixed, the dashboard starts describing reality instead of process folklore.
For teams that use product or web measurement concepts as a model, the Speculation Rules API resource is a reminder that measurement systems work best when data loading, routing, and state handling are deliberate. Hiring analytics needs the same discipline, even if the business problem is very different.
Benchmarks only help when you compare like with like. A frontline hiring funnel behaves differently from an executive search pipeline, and a mobile-first hourly applicant pool won't move the same way a professional-services candidate does. The point of benchmarking is not to chase a universal target, it's to understand whether your own funnel is healthy relative to the role type you hire for.
For frontline and high-volume roles, mobile behavior changes the baseline. Fountain's mobile-hiring data reports that 85% of candidates apply from their phones, that the U.S. average from application to offer in frontline roles is 27.5 days, and that 25% of candidates rank turnaround time as the top offer-acceptance factor besides pay (Fountain candidate experience metrics). That combination points to a different operating model, where speed, mobile usability, and fast follow-up affect candidate experience more directly than they do in slower, relationship-heavy searches.
| Industry | Application completion rate | Time-to-hire (days) | Candidate NPS | Offer acceptance rate |
|---|---|---|---|---|
| Healthcare | Use your internal historical baseline and compare by role family. For bedside and shift-based roles, watch mobile completion and stage drop-off more closely than overall site traffic. | Use your internal historical baseline and compare by role family. Fast response matters most when scheduling is the bottleneck. | Use your internal historical baseline and compare by role family. Scores often move with communication quality and schedule clarity. | Use your internal historical baseline and compare by role family. Acceptance can fall when credentialing or shift details are unclear. |
| Manufacturing and logistics | Use your internal historical baseline and compare by role family. Completion usually tracks with mobile form length and local labor availability. | Use your internal historical baseline and compare by role family. Delays often come from interview coordination and shift confirmation. | Use your internal historical baseline and compare by role family. Candidates tend to respond to speed and straightforward process updates. | Use your internal historical baseline and compare by role family. Acceptance weakens when start dates or work conditions are not clear early. |
| Retail and hospitality | Use your internal historical baseline and compare by role family. High-volume funnels usually need short forms and quick next-step prompts. | Use your internal historical baseline and compare by role family. Same-day or near-same-day response patterns matter more here than in most salaried roles. | Use your internal historical baseline and compare by role family. Candidate sentiment is sensitive to delay and repeated handoffs. | Use your internal historical baseline and compare by role family. Acceptance improves when scheduling, pay, and location details are easy to understand. |
| Professional services | Use your internal historical baseline and compare by role family. Completion may be lower if applications ask for more context, but qualified candidates tolerate that better. | Use your internal historical baseline and compare by role family. Longer cycles are common because interview depth matters. | Use your internal historical baseline and compare by role family. Candidates react more strongly to role clarity and interview quality than to raw speed. | Use your internal historical baseline and compare by role family. Acceptance is usually tied to compensation, growth path, and manager quality. |
| Government | Use your internal historical baseline and compare by role family. Applications often involve more steps, so compare within the same process type. | Use your internal historical baseline and compare by role family. Cycle time can be driven by process requirements rather than recruiter speed. | Use your internal historical baseline and compare by role family. Candidate feedback often reflects transparency and communication gaps. | Use your internal historical baseline and compare by role family. Acceptance can be affected by process length and documentation burden. |
| Tech | Use your internal historical baseline and compare by role family. Completion changes with employer brand strength and the amount of upfront screening. | Use your internal historical baseline and compare by role family. Strong teams usually track time by stage, not just the final average. | Use your internal historical baseline and compare by role family. Candidate NPS often rises when interviews are structured and communication is consistent. | Use your internal historical baseline and compare by role family. Acceptance depends on compensation, role scope, and interview experience. |
Benchmarking rule: Compare your funnel to the peer group that shares your applicant behavior, not just your industry label.
That rule matters most in mixed portfolios. A health system hiring nurses, lab staff, and corporate functions needs separate comparisons for each role family, because the candidate journey is not the same across those groups. The same applies to hospitality employers that hire both salaried managers and hourly frontline staff, or tech companies that run very different processes for engineers and operations roles. If you blend those funnels together, the benchmark stops describing performance and starts hiding it.
Use your own historical data first, then check external numbers to see whether the gap is meaningful. External benchmarks work as guardrails, not goals. The best internal target reflects your candidate mix, your process design, and your labor market, and it gives you a cleaner read on whether a change in screening, scheduling, or communication improved the funnel.
A convincing dashboard can hide a broken process for months. A few clean-looking metrics can still mask where candidates are dropping out, especially when teams treat one number as the whole journey. The safest way to keep candidate experience metrics honest is to test each metric against the stage it is supposed to explain.
NPS is useful, but it is easy to read too much into it. Response bias and survey timing can swing results, and a small sample can make a loud outlier look like a trend. If you only watch one sentiment score, you usually learn more about who responded than about the process itself.
A strong application completion rate can still hide a weak form if the form is attracting the wrong people or screening out qualified ones too early. Completion tells you that people finished, not that the experience was useful or that the right candidates stayed engaged. Pair completion with stage progression and interview movement so you can see whether the funnel is healthy or just busy.
Time-to-hire is informative, but a single average can hide where the delay occurred. Median scheduling delay and time per stage are more diagnostic because they point to the bottleneck, whether that is recruiter response time, hiring manager availability, or unnecessary manual review. If you want to improve speed, you need to know which step is slow.
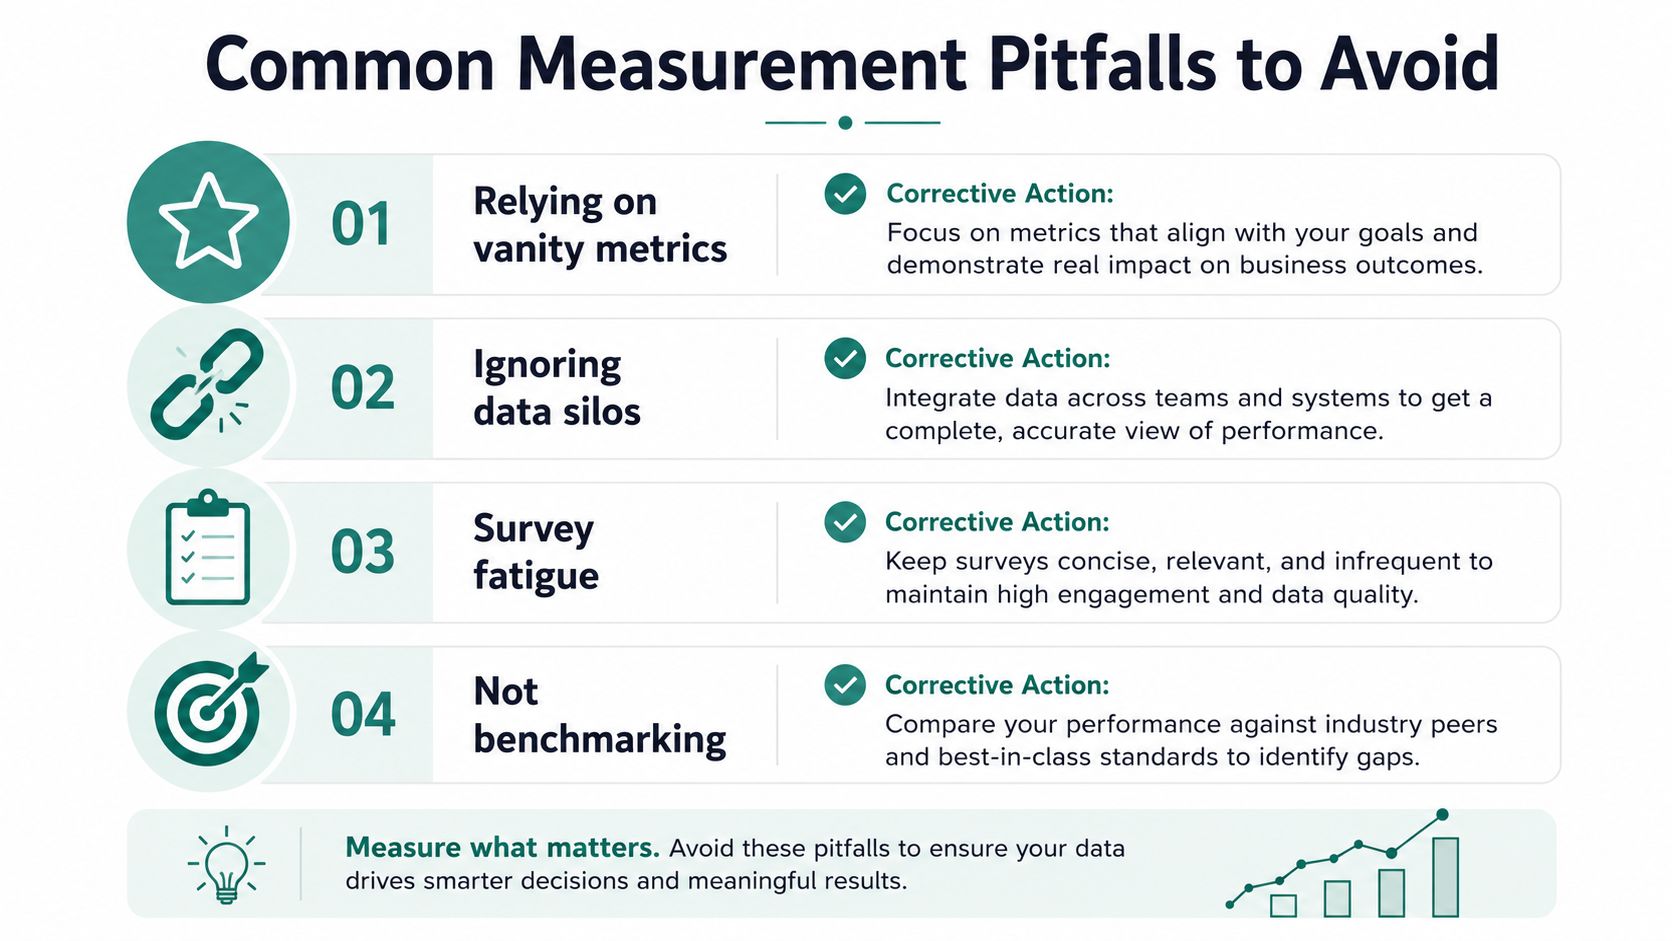
A few guardrails keep the system sane: - Define drop-off carefully: Exclude candidates who were legitimately disqualified by agreed criteria, so you are measuring friction, not eligibility. - Separate requisition types: Keep hourly, salaried, and executive searches in different views, because the process logic is not the same. - Review interview consistency: If structured rubrics are not used consistently, progression data becomes interviewer-dependent. - Watch survey timing: Send feedback requests at a moment that reflects the stage you want to evaluate, not at a random administrative checkpoint.
The best dashboards are skeptical by design. They force a hiring team to question whether a good-looking metric reflects a good process or a neatly formatted lie.
The biggest mistake teams make with automation is assuming it's only about saving recruiter time. Used well, conversational screening changes candidate experience metrics by changing the candidate's waiting pattern, response path, and evaluation consistency. Used badly, it can create new friction that hides behind fast response times.
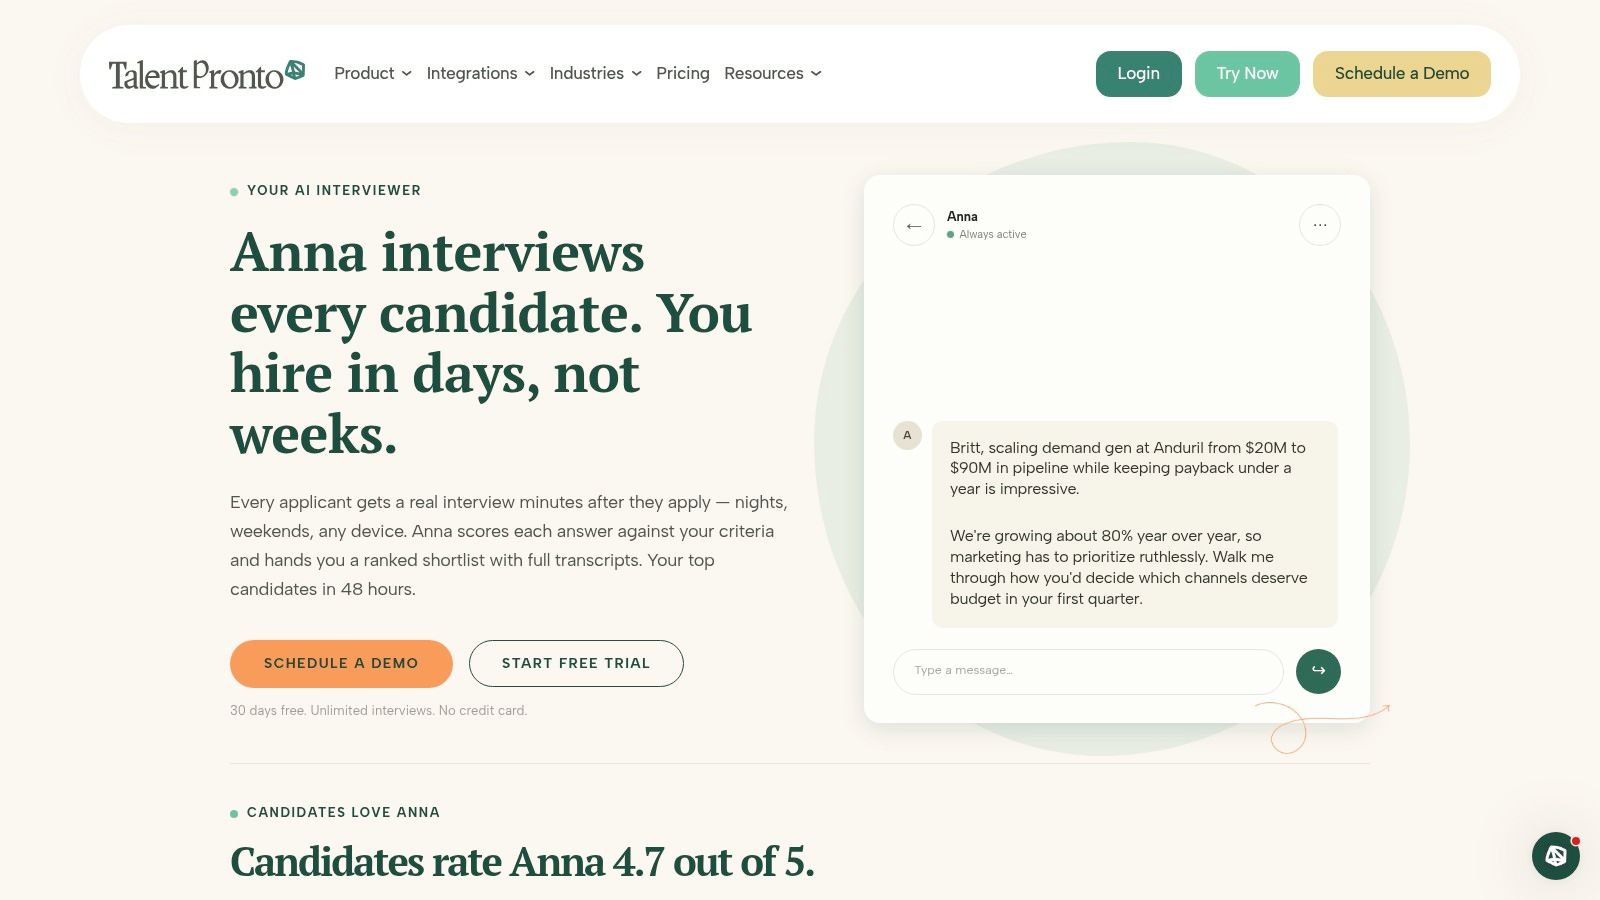
A 24/7 conversational screen removes the wait-for-recruiter gap that makes candidates abandon in-progress applications. That matters most in high-volume funnels, where delays compound quickly and the candidate may already be interviewing elsewhere. When candidates can answer questions immediately on web or mobile, completion tends to improve because the process no longer depends on office hours.
Structured rubrics change a different set of metrics. They make interviews more consistent, which improves the reliability of progression decisions and reduces the chance that one interviewer's style skews the funnel. That consistency matters most when you're trying to compare interview-to-offer ratios across teams or assess whether the same role is being evaluated the same way.
Automated scheduling usually has the clearest speed impact. It cuts the back-and-forth that inflates median scheduling delay, and it stops a qualified candidate from sitting in limbo while calendar email threads pile up. In practice, that's often the most visible operational win because it changes a metric teams already feel pain from.
Practical rule: If a metric is driven by waiting, automation can usually improve it. If a metric is driven by judgment, automation should standardize the input, not replace the decision.
Talent Pronto is one option in this space. It uses conversational screening across web and mobile, role- and industry-aware question sets, structured scorecards, and ATS or HRIS integrations such as Greenhouse, iCIMS, Paylocity, ADP, and Workday to keep candidate data and statuses aligned. It also keeps advancement and rejection decisions with the employer, which matters if you want automation to support the process instead of owning it.
The risk is misconfiguration. If the Q&A is inaccurate, if candidates can't opt out, or if a screening flow asks questions that don't map to the role, the metric gains won't last. Automation should reduce friction, not create a new opaque layer between the candidate and the hiring team.
The practical test is simple. If conversational screening improves completion, structured rubrics stabilize decisions, and scheduling automation shortens time to interview, the dashboard should show movement in the right direction. If it doesn't, the workflow needs tuning before the software gets credit.
A good candidate experience program doesn't need a giant implementation window. It needs a clean sequence, clear ownership, and a dashboard that answers real questions instead of displaying every number available. The fastest path is a 30-60-90 day rollout.
Start by wiring ATS, HRIS, scheduling, and screening data into a single source of truth. Lock the stage taxonomy, define what counts as start and completion, and pull a historical baseline so the team can see the before state. If the definitions aren't stable here, every later target will wobble.
Deploy post-apply and post-interview surveys with clear opt-out language, then review structured-rubric adherence across interviewers. If you're already using a system like Talent Pronto, this is the point to verify that scorecards, interview routing, and candidate messaging are consistent across requisitions. The how to improve candidate experience guide is a useful companion for teams that want the operational playbook behind the measurement plan.
Put funnel, speed, sentiment, and fairness panels side by side so a single screen answers whether the system is healthy. The best layout is not the one with the most charts, it's the one that lets a recruiting leader spot where to intervene in under a minute. Review targets on a fixed cadence, assign one owner to metric definitions, and escalate only the measures that reflect process failure, not random fluctuation.
A well-run dashboard should make the conversation sharper. Instead of asking whether candidate experience is “good,” the team can ask whether applications are completing, whether interviews are moving on time, whether candidates feel respected, and whether the process is being applied consistently. That's the level where recruiting operations becomes manageable.
When should candidate experience surveys go out? Send them at the stage you want to measure, not at a generic end point. Post-apply and post-interview are the two most useful moments because they capture different kinds of friction.
Should I use standalone surveys or embedded conversational surveys? Use the tool that fits your process depth. Standalone surveys are fine for simple feedback loops, while embedded conversational surveys work better when you want completion, question routing, and candidate Q&A in the same flow.
How often should benchmarks change? Revisit them when your process changes materially, or when your role mix shifts enough that the old peer group no longer fits. Benchmarks are reference points, not permanent truths.
What should I do if one metric changes suddenly? Check whether the change came from a process shift, a data definition issue, or a real candidate behavior change. The fastest way to avoid bad conclusions is to compare the metric against a second signal from the same stage.
Talent Pronto helps teams measure and improve candidate experience with conversational screening, structured scorecards, and dashboard-ready hiring data. If you're trying to turn application completion, speed, and interview consistency into a usable operating system, visit Talent Pronto and see how the workflow fits your hiring process.

Talent Pronto is an AI-powered hiring platform built around Anna, our intelligent AI that conducts 24/7 conversational screening, evaluates candidates against specific job requirements and compliance needs, and schedules interviews. Run everything on the Talent Pronto ATS, our all-in-one applicant tracking system with a branded careers site and Anna built in, or keep your existing ATS and let Anna integrate with Greenhouse, Ashby, iCIMS, Jobvite, Lever, Oracle, and more. Either way, we help organizations reduce time-to-hire and build stronger teams.