Learn how employee journey mapping improves hiring, onboarding, and retention. See stages, KPIs, real examples, and how AI tools support execution.
A hiring manager arrives on Monday to find three requisitions stalled, two new hires who stopped responding after accepting their offers, and a compliance notice for incomplete I-9s. Recruiting blames the hiring managers, HR operations blames the applicant tracking system, and the managers ask for another urgent meeting. Everyone sees a symptom. Nobody can see the journey.
That's the operating problem employee journey mapping solves. It shows where people encounter the organization, what they're expected to do, how the experience feels, which team owns the next action, and whether the handoff produces the intended outcome. The method borrows discipline from customer experience journey mapping, then applies it to the complete employee lifecycle, from attraction and recruitment through development, retention, exit, and alumni relationships.
The strongest maps aren't attractive timeline posters. They're data-linked operating tools that expose execution gaps between functions. That distinction matters in healthcare, manufacturing, and other high-volume environments, where a missing credential, delayed system access, or unclear approval can derail an otherwise well-designed process. It also connects employee experience to employer brand, as the wider context of what employer branding means makes clear.
Employee journey mapping emerged from customer experience journey mapping, then HR teams adapted it in the mid-2010s as employee experience became a strategic priority. SHRM describes the practice as spanning the full employee lifecycle, from attraction and recruitment to onboarding, development, retention, and exit, shifting HR from isolated processes toward a continuous lifecycle view (SHRM's employee experience resource).
That shift changes the question leaders ask. Instead of asking whether recruiting, onboarding, or compliance has a process, they ask whether the person experiences one coherent path across those functions. A candidate doesn't care which team owns the delay. A new nurse knows that the badge wasn't ready, the EHR training wasn't scheduled, and nobody could explain whether the first shift was still happening.
A map makes those seams visible. At each handoff, record the outgoing action, the receiving owner, the expected completion time, the employee's emotional signal, and the operational result. If a requisition moves from recruiter to hiring manager without a confirmed interview window, that's not merely a communication issue. It's an ownership and control failure.
The practice remains unevenly formalized. One 2024 benchmark cited in an HR glossary reports that only 17% of organizations have mapped the employee journey end-to-end (Hyring's employee journey mapping glossary). The same source cites 4x higher profit growth for companies with strong employee experience programs, although that figure should be treated as an industry-reported benchmark, not a guaranteed result for every mapping initiative.
Practical rule: If a map doesn't identify the handoff, the owner, and the measure, it's documentation, not management.
Begin with the failure leaders already feel. A stalled hiring funnel, early attrition, incomplete training, or recurring employee-service tickets gives the workshop a business reason to exist. Then map backward until the team can identify where the experience first diverged from the process leaders thought they had built.
Employee journey mapping is a visual, data-informed model of the interactions a person has with an employer across the full lifecycle. A useful map layers four perspectives: observable touchpoints, the employee's emotional response, the backstage work and ownership behind each touchpoint, and measurable outcomes such as completion, delay, engagement, attrition, or retention.
The lineage comes from customer experience programs, but employee journeys are harder to manage. Employees and candidates operate within legal, policy, credentialing, and access constraints. They can't switch providers when an internal process fails, and responsibility often crosses Talent Acquisition, HR operations, IT, payroll, compliance, facilities, and a hiring manager. Internal politics can make the official owner different from the person doing the work.
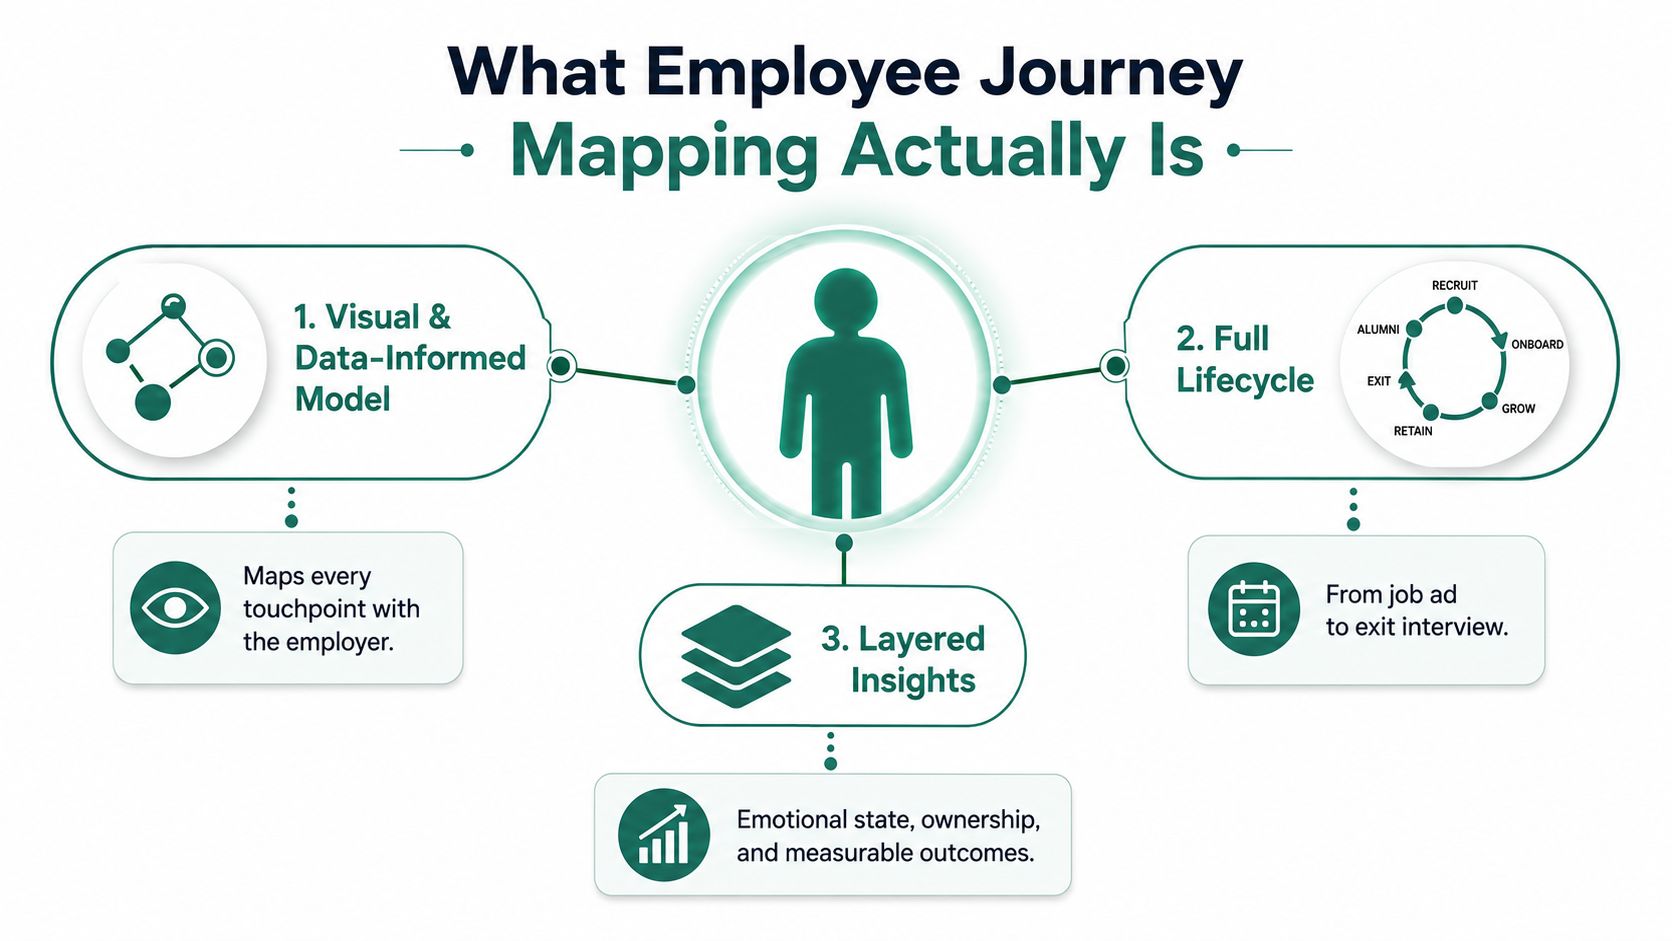
Consider a nurse joining a hospital. The visible journey may include the job advertisement, application, recruiter conversation, interview, offer, credentialing, badge issuance, EHR training, orientation, and first shift. Behind those moments sit different owners: Talent Acquisition, the credentialing team, HR operations, security, clinical education, IT, and the unit manager.
Each touchpoint has a different failure mode. Credentialing may wait for a document, security may lack a start-date update, IT may provision access against an outdated roster, or the unit manager may assume orientation has already covered a required workflow. The nurse experiences one journey, even though the organization runs several disconnected processes.
That's why a journey map isn't the same as a process flow. A process flow shows the work from the organization's perspective. A journey map shows what the employee sees, feels, completes, and receives, including the backstage steps that determine whether the experience works. The process tells you that an approval exists. The journey map tells you that the employee waited, contacted HR twice, and arrived without access.
A practical map uses lifecycle stages as containers, not conclusions. The six broad stages are attraction, recruitment, onboarding, development, retention, and exit or alumni. Each stage becomes a grid of diagnostic cells containing a touchpoint, owner, time-to-complete measure, emotional signal, data source, and outcome.
| Stage | Key Touchpoints | Primary Owner | Time-to-Complete | Emotional Signal |
|---|---|---|---|---|
| Attraction | Career-site visit, job description, employer-brand content | Talent Acquisition | Minutes for the site-to-application handoff | Curiosity or confusion |
| Recruitment | Application, screening, interviews, offer, post-offer contact | Recruiter and hiring manager | Varies by role and workflow | Hope, frustration, or uncertainty |
| Onboarding | Offer acceptance, paperwork, access, orientation, first-week plan | HR operations and hiring manager | Offer to first day can span 1–3 weeks | Anxiety or reassurance |
| Development | Training, coaching, performance conversations, career planning | Manager and People Partner | Ongoing, with scheduled review points | Motivation, ambiguity, or recognition |
| Retention | Daily work, support, recognition, mobility, manager interactions | Manager and People Partner | Continuous | Belonging or isolation |
| Exit or alumni | Resignation, knowledge transfer, access removal, exit interview, rehire contact | HRBP and functional owner | Resignation to exit interview can span 1–2 weeks | Relief, regret, or advocacy |
The recruitment cell should show where a candidate reads the role, applies, answers screening questions, schedules interviews, receives updates, and evaluates the offer. The onboarding cell should capture paperwork, equipment, credentials, system access, team introductions, and the first confidence check. For distributed or cross-border hiring, practical resources on relocation assistance programs can help teams account for mobility-related touchpoints rather than treating them as an exception outside the journey.
Emotions aren't decorative annotations. A repeated frustration signal beside an application form may point to unnecessary fields or unclear instructions. Anxiety between offer acceptance and the first day may indicate missing communication, unresolved relocation needs, or a manager who hasn't received the start-date checklist.
The most revealing data usually sits between stages. Attraction hands to recruitment. Recruitment hands to onboarding. Onboarding hands to the manager and frontline operation. Exit hands knowledge, access, and feedback back to the business. When the owner changes, the employee often has to repeat information, wait for confirmation, or infer what happens next.
A map that only lists stages hides that degradation. A map that records each handoff can show precisely where accountability blurs and where a small process change may prevent a larger experience failure.
Run the build as an operating workshop, not a brainstorming session. A focused team can work through the sequence in a practical two-week cycle, provided it starts with a business outcome and limits the scope to one role, cohort, or business unit.
Before drawing an arrow, define the problem. Are you investigating candidate drop-off, delayed clinical readiness, incomplete training, early attrition, or inconsistent manager handoffs? Choose one population, such as medical assistants, production supervisors, or newly hired nurses, and state where the map begins and ends.
Then gather evidence for the current state. Pull verbatim employee comments, candidate feedback, support tickets, HRIS records, learning-system activity, and timeline measures. Use quantitative data first to locate friction or attrition spikes, then interview targeted cohorts such as very early leavers, low-engagement employees, and top performers. This mixed-method sequence helps the team avoid treating the loudest anecdote as the most important problem (AIHR's employee journey mapping guidance).
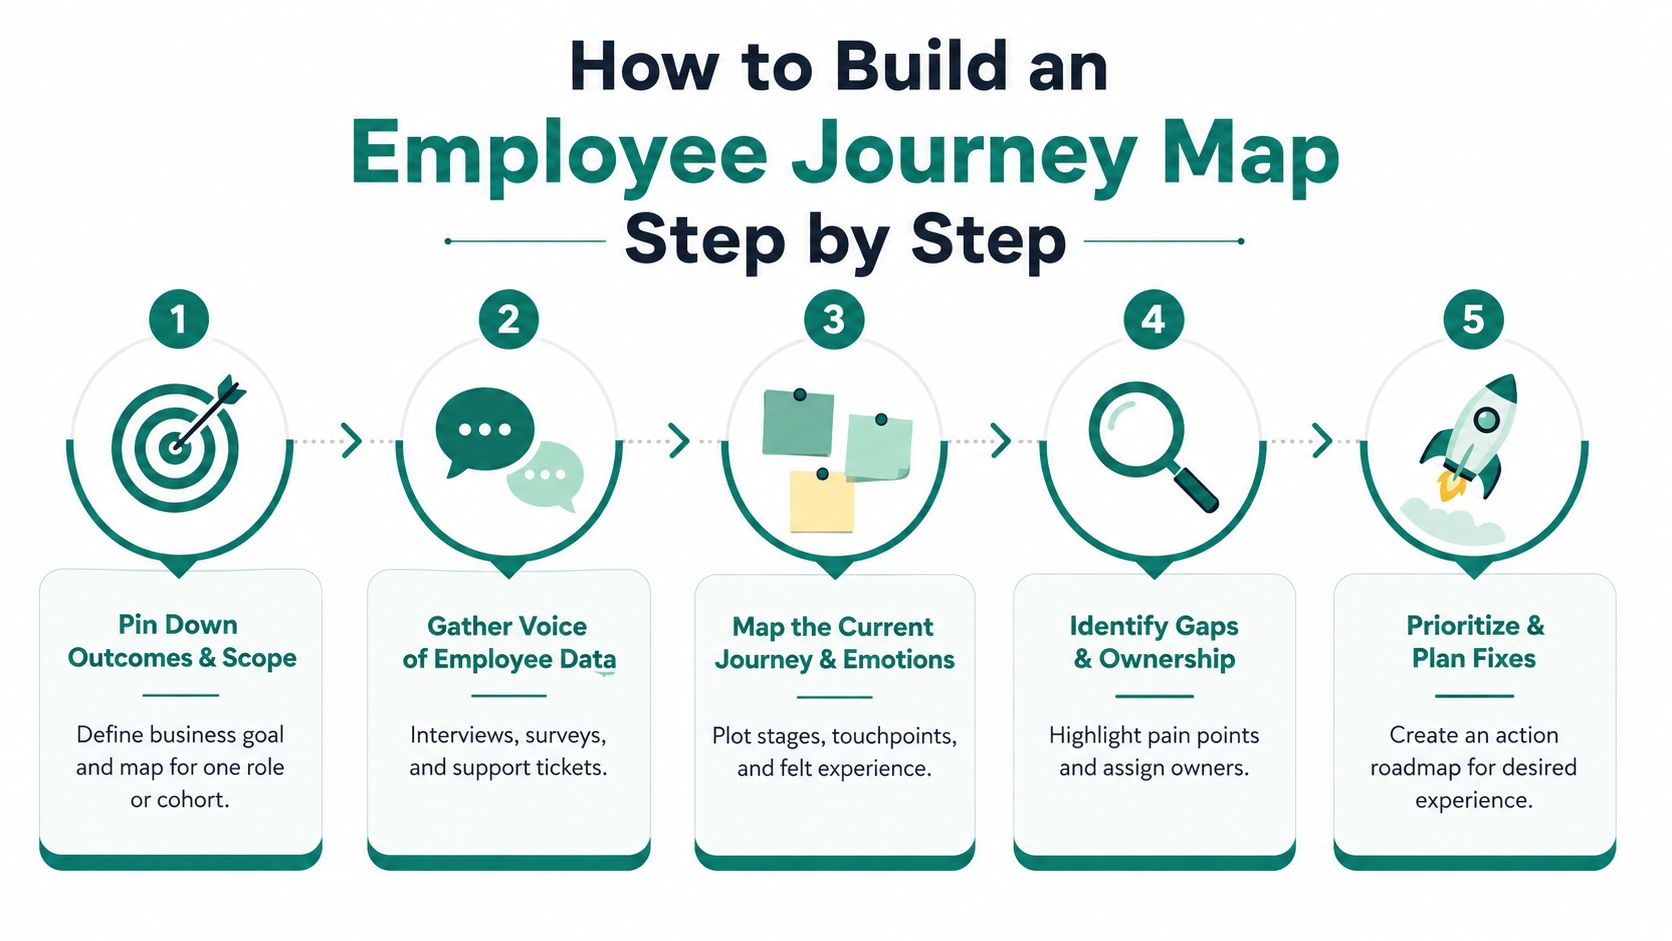
For every pain point, ask what caused it. “New hires don't complete training” is a symptom. The cause might be an inaccessible learning portal, unclear assignment rules, missing protected time, or a supervisor who never receives completion alerts.
Build the future state with named owners, target service levels, and an explicit handoff moment. Useful outputs include:
Most maps stall at current-state documentation. Teams collect anecdotes, place them on sticky notes, and stop before assigning ownership or defining a measure. The result is a polished slide deck that nobody reviews during weekly operations.
A map earns its place when a manager can use it to decide who acts next, what completion looks like, and which system records the result.
Use a practical framework that defines outcomes and segments, maps the current state, identifies root causes, designs the future state, and prioritizes a 12–16 week roadmap with 6–10 high-impact interventions (Umbrex's employee journey mapping framework). Store the map where owners already work, then review the measures often enough to catch drift.
Teams selecting systems should also understand their wider HR tech stack, because a journey map fails when its data sources and integrations remain undefined.
The business case is strongest when a map connects a visible experience problem to an operational control. Recruiting teams can see where candidates abandon applications, miss interviews, wait for updates, or disengage after an offer. Onboarding teams can identify which credential, access, training, or manager handoff delays readiness. Retention teams can examine risk by tenure cohort instead of relying on a single sentiment score.
In recruiting, track each stage of the funnel separately. A total time-to-fill measure can tell you that hiring is slow, but it can't tell you whether the delay comes from application completion, screening, interview scheduling, feedback collection, or approvals. Candidate feedback at the offer stage adds context that a funnel report alone misses.
In onboarding, connect completion to readiness. For clinical and frontline roles, credential verification, equipment, system access, and required training may determine whether a new hire can perform meaningful work. A map makes those dependencies visible and gives HR operations a way to distinguish a late employee from a late internal task.
Retention mapping works best as an early-warning system. Look for recurring friction in manager conversations, learning access, internal mobility, workload, and support requests, then compare those signals with attrition by tenure. Survey-only programs rarely move attrition because they collect sentiment without assigning a process owner or changing the underlying work.
| Function | Mapped Outcome | Leading KPI | Baseline Range |
|---|---|---|---|
| Recruiting | Fewer stalled handoffs and candidate drop-offs | Application completion, interview no-shows, time-to-fill | Establish from current funnel data |
| Onboarding | Faster readiness and fewer missing tasks | Access completion, training completion, time-to-productivity | Establish by role and cohort |
| Retention | Earlier identification of avoidable friction | Risk signals by tenure, manager follow-up, regrettable loss | Establish from HRIS and listening data |
| Compliance | Documented completion of required controls | I-9 completion, licensure status, training attestations | Establish from audit records |
Journey maps can expose missing I-9 steps, expired licenses, incomplete training, and unacknowledged policies. They don't replace legal advice or a compliance system, but they can show where evidence is created, who checks it, and what happens when a deadline is missed.
The limits matter. A map won't fix understaffing, poor management, misaligned compensation, or unsafe work. It also won't survive on HR enthusiasm alone. Without executive sponsorship, clear ownership, and a recurring operating review, the program can decay within two quarters.
Independent industry reporting links strong employee experience programs with 4x higher profit growth, while also reporting that only 17% of organizations map the journey end-to-end (the cited Hyring benchmark). Those figures support treating the map as a management system, but they don't prove that drawing a map causes financial improvement. The intervention, ownership, and measurement still determine the result.
Most organizations begin with the intended experience. Leaders describe what policy, onboarding checklists, service standards, or process diagrams say should happen. That layer is useful, but it's often an assumption disguised as a fact.
The actual experience comes from employees, candidates, and managers at the moment of interaction. Use short pulse questions, support-ticket reviews, interview notes, exit conversations, and behavioral data. Annual engagement scores can provide context, but they're too distant from a specific handoff to explain why a candidate stopped responding or why a new hire couldn't access the EHR.
The desired experience is the future state the team is willing to fund and operate. It needs a named owner, a measurable service level, and a clear definition of completion.
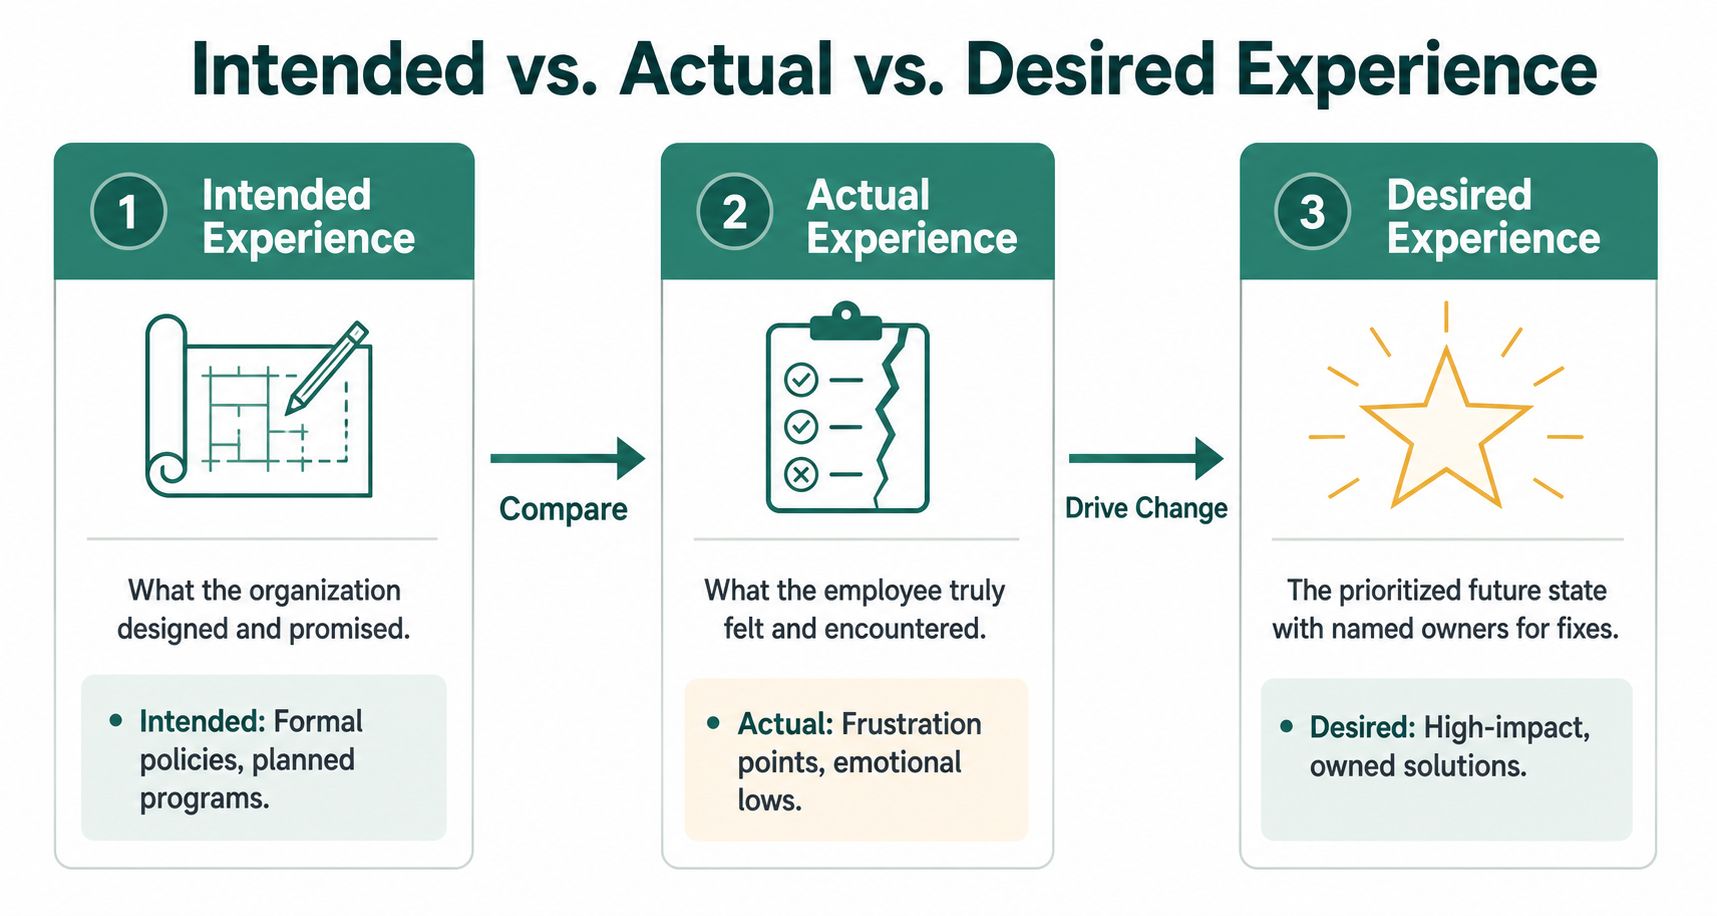
Suppose the intended process says an offer should be completed within 10 days. Current evidence shows the actual journey taking 27 days, with a candidate lost during the third week. The desired state sets a 14-day SLA, owned by the Talent Acquisition partner, with a hiring manager escalation when feedback misses its commitment.
The gap between intended and actual is a credibility problem. The organization promised one experience but delivered another. The gap between actual and desired is the roadmap, because it identifies the change the team has chosen to make.
| Layer | What it captures | Management question |
|---|---|---|
| Intended | Formal policies and designed workflows | What do leaders believe happens? |
| Actual | Reported friction, emotions, delays, and workarounds | What does the person encounter? |
| Desired | Prioritized future state with owners and SLAs | What will change, and who is accountable? |
Keep the comparisons separate. A team can improve an email template and declare success while the approval delay remains unchanged. Measuring all three layers prevents cosmetic improvements from being mistaken for a better journey.
A journey map becomes useful when each stage has a small set of operational measures. Choose metrics that show movement through the journey, not only how people feel about it.
Leading indicators reveal friction early. Application drop-off, interview no-shows, delayed feedback, unanswered candidate questions, incomplete paperwork, and missing system access can trigger intervention before the employee reaches a later failure point. Lagging indicators confirm the longer-term result, including annual attrition, regrettable losses, retention by tenure, and sustained time-to-productivity.
| Stage | Primary KPI | Data Source | Cadence |
|---|---|---|---|
| Attraction | Career-site-to-application movement | Career site and ATS | Ongoing review |
| Recruitment | Screen-to-submit ratio and candidate offer feedback | ATS, screening platform, candidate listening | Weekly or per requisition |
| Onboarding | Completion by day 30, 60, and 90 | HRIS, LMS, IT service records | Weekly during ramp |
| Development | Training consumption and milestone completion | LMS and talent platform | Monthly or milestone-based |
| Retention | Attrition by tenure and manager follow-up | HRIS, pulse listening, case data | Monthly |
| Compliance | Training attestations and required-document status | Compliance, HRIS, LMS | Ongoing control review |
The recruiting stage is especially suitable for real-time listening. A conversational hiring platform can capture a candidate's questions, screening answers, completion behavior, and sentiment signals as the interaction occurs. Those records can become touchpoint data, provided the employer defines consent, retention, access, auditability, and human review rules before deployment.
A tool such as Talent Pronto can function as a listening post across early recruiting by engaging applicants through conversational screening, asking role-specific questions, and producing structured scorecards. The useful journey-mapping insight isn't merely that automation exists. It's the pattern across interactions: where applicants stop, which questions create confusion, how long qualified candidates wait for scheduling, and whether the information provided matches the employer's stated process.
That data should flow back into the map rather than remain trapped in a vendor dashboard. Teams working on people analytics in HR can use the same principle across later stages, linking journey events to HRIS, LMS, sentiment, and behavioral incident data.
AI needs governance. Don't collect every possible signal just because a platform can. Define the minimum data needed for the decision, offer a traditional path where appropriate, document the criteria, and keep final advancement and rejection decisions with the employer. Otherwise, real-time listening becomes continuous surveillance instead of responsible experience measurement.
Consider a representative retail healthcare network operating 40 clinics and mapping the journey for medical assistants from their first job-board impression through 18-month retention. The leadership team assumed the main problem was applicant volume. The map showed a different pattern: friction accumulated at handoffs between recruiting, credentialing, clinic operations, and development.
Attraction data showed career-site drop-off and incomplete applications. Talent Acquisition simplified the role information and assigned ownership for unanswered candidate questions. The recruiting team then tracked screening time and interview feedback, while the hiring manager owned a defined response point after each interview. Candidate experience feedback at the offer stage became a signal for whether the process felt clear and credible.
Onboarding exposed a clinical credentialing handoff that everyone believed was closed. The credentialing team owned verification, HR operations owned paperwork, and the clinic manager assumed both were complete before the first shift. The intervention was a shared readiness checklist with one accountable owner and a visible exception path. The team paired that with a day-30 confidence check, so managers could identify access, training, or workflow problems before they became performance concerns.
Development mapping followed the first months of work. Preceptor satisfaction and certification milestones showed whether the new assistant had structured support, not merely a completed orientation. The clinic manager owned preceptor follow-up, while the People Partner reviewed milestone patterns across clinics.
Retention signals focused on tenure risk rather than a single engagement score. Managers reviewed recurring support issues, missed development conversations, and changes in confidence. Exit mapping added a structured interview and rehire eligibility decision, giving HR a way to separate a preventable process failure from a departure that left the relationship intact.
The map itself didn't create those improvements. Named ownership at every handoff did. The artifact exposed gaps leadership had assumed were closed, then connected each intervention to a measure and a person responsible for maintaining it.
Talent Pronto offers conversational screening, structured scorecards, candidate Q&A, scheduling, analytics, and ATS or HRIS integrations that can turn recruiting touchpoints into live journey data. Visit Talent Pronto to see how its AI-powered hiring platform can help you map and improve the recruiting experience in real time.

Talent Pronto is an AI-powered hiring platform built around Anna, our intelligent AI that conducts 24/7 conversational screening, evaluates candidates against specific job requirements and compliance needs, and schedules interviews. Run everything on the Talent Pronto ATS, our all-in-one applicant tracking system with a branded careers site and Anna built in, or keep your existing ATS and let Anna integrate with Greenhouse, Ashby, iCIMS, Jobvite, Lever, Oracle, and more. Either way, we help organizations reduce time-to-hire and build stronger teams.