Learn which quality of hire metrics predict success, how to build a composite score, and operationalize measurement today.
Most advice about quality of hire metrics starts with a formula. That's the wrong place to start. The core problem is more basic: many employers haven't connected hiring decisions to what happens after someone joins, so they can't tell whether their screening criteria predict performance, retention, or productive contribution.
SHRM's 2025 benchmarking report says only 20% of organizations track quality of hire (SHRM). That implementation gap matters more than choosing an elegant formula. A useful model has to work before annual reviews are complete, survive inconsistent manager input, and reveal where hiring, onboarding, or role design is breaking down.
Quality of hire is not a KPI waiting inside an ATS dashboard. It is a constructed outcome measure, built from signals that show whether a new employee is succeeding after joining. That distinction matters because most organizations do not track it consistently, so a complex formula often fails before the data is ready.
SHRM lists turnover, job performance, employee engagement, and cultural fit assessed through 360 ratings among the common measures (SHRM guidance). In practice, quality of hire works better as a role-specific view of post-hire results against the expectations set before hiring, rather than as a universal score.
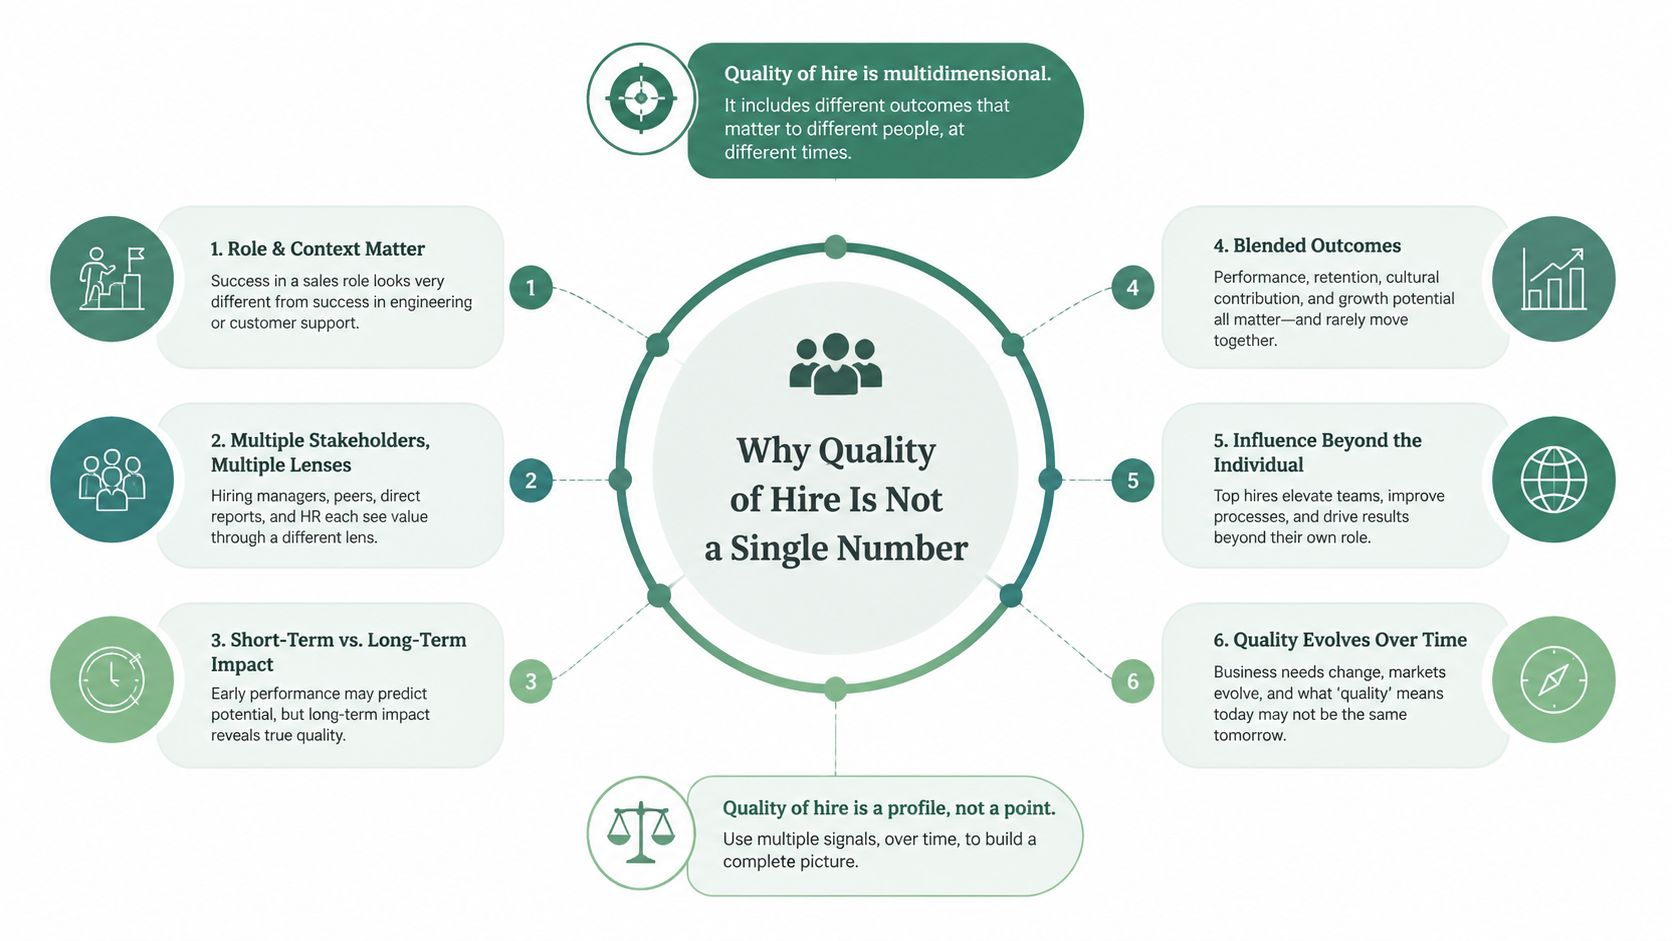
A single measure invites gaming. If recruiters are judged only on retention, they may favor candidates who seem unlikely to leave, even when those hires produce weak work. If managers are judged only on performance ratings, they may inflate scores to avoid difficult conversations or conceal weak onboarding.
One-number reporting also creates survivorship bias. Employees who leave early disappear from later performance datasets, while remaining employees are more likely to receive a formal review. The average can therefore look healthy while excluding hires who exited before the organization gathered meaningful evidence.
The feedback loop is slow. A 12-month outcome can support retrospective analysis, but by then the sourcing strategy, interview panel, recruiter, or manager may have changed. A practical model needs earlier signals that support process correction before the annual review arrives.
Practical rule: Treat the score as an index, not a fact of nature. Give every component a named owner, collection date, defined scale, and reason for inclusion.
A defensible model usually combines retention, performance, manager satisfaction, and time to productivity. Some teams add engagement, peer feedback, internal mobility, or role-specific output. The right mix depends on what success means in the job and how quickly each signal becomes observable.
SHRM describes quality of hire through the value a new employee contributes to company success, and explains how analytics can connect that value to post-hire signals such as first-year success and impact (SHRM's analytics guidance). Early proxies can support decisions while lagging outcomes mature, but they measure different things. Ramp speed is not performance, and manager sentiment is not retention.
Quality of hire becomes useful only when the organization can calculate it consistently. A detailed model with missing performance records is weaker than a smaller model populated reliably across roles. That implementation gap matters because many organizations still do not track quality of hire at all. The first model should therefore be minimal, defensible, and usable before 12-month reviews are available.
Industry guidance often uses 12-month performance as the anchor benchmark, with a target of 75% or more of new hires meeting or exceeding expectations at the one-year mark (Metaview recruiting benchmarks). Treat that benchmark as a reference point, not a universal standard. Strong performance alongside weak retention may indicate inaccurate expectations, poor manager fit, or a role that differs from how it was presented. It does not automatically prove that screening failed.
First-year performance rating compares an employee's outcome with success criteria defined before hiring:
Employees meeting or exceeding expectations at one year ÷ eligible new hires with a completed rating
Use the HRIS or performance management system, while standardizing rating scales and defining “meeting expectations.” Comparisons break down when managers assess different evidence or use different standards at different points in the employee lifecycle.
New-hire retention at 12 months is:
New hires still employed at 12 months ÷ eligible new hires in the cohort
Separate voluntary from involuntary exits. Voluntary departures can point to expectation mismatch, weak management, or poor role fit. Involuntary exits may involve performance, misconduct, restructuring, or onboarding problems. One combined rate conceals those causes.
Ramp time to full productivity measures the period between the start date and independent delivery of the role's expected output. Define productivity by role. A manager attestation may suit an operations position, while quota attainment, completed work, or approved deliverables may suit sales, engineering, or professional services.
Hiring manager satisfaction should come from a standardized survey item or composite rating collected after the manager has observed the hire performing the job. Ask whether the person meets agreed role expectations. Avoid asking whether the manager “likes” the hire. Timing also matters, since an early response may reflect interview enthusiasm or onboarding friction rather than sustained contribution.
Promotion rate within 18 months fits professional career tracks with defined promotion pathways. It should remain a contextual measure, not a universal quality proxy. Promotion depends on organizational structure, manager behavior, available positions, and compensation policy, so promotion alone cannot establish that a hire performed well.
| Metric | Formula | Data Source | Benchmark | Common Pitfall |
|---|---|---|---|---|
| First-year performance | Hires meeting or exceeding expectations ÷ eligible rated hires | Performance management system or HRIS | 75%+ meeting or exceeding expectations at one year | Inconsistent ratings and incomplete reviews |
| 12-month retention | Hires employed at 12 months ÷ eligible cohort | HRIS, ATS, or workforce system | Interpret alongside performance and exit type | Blending voluntary and involuntary exits |
| Ramp time | Date of independent productivity minus start date | Manager workflow, HRIS, operational system | Set by role, not globally | Vague definitions of “productive” |
| Manager satisfaction | Standardized manager score against role expectations | Survey or engagement tool | Use a consistent internal baseline | Recency bias and personal preference |
| Promotion within 18 months | Eligible hires promoted within 18 months ÷ eligible professional hires | HRIS | Role and career-path dependent | Treating promotion as pure performance evidence |
LinkedIn's recruiting research lists job performance, retention or new-hire turnover, hiring manager satisfaction, and skills match among signals used by talent acquisition teams (LinkedIn Future of Recruiting). Before combining these measures, audit the fields your systems contain. Mark each as reliable, partially reliable, or unavailable. Until annual reviews mature, use the reliable early signals as directional indicators, label their limits, and assign an owner for improving the missing data.
A single quality-of-hire formula rarely survives contact with different jobs. A warehouse associate and a software architect have different outputs, ramp patterns, and reasons for leaving, so the metric mix must follow the work.
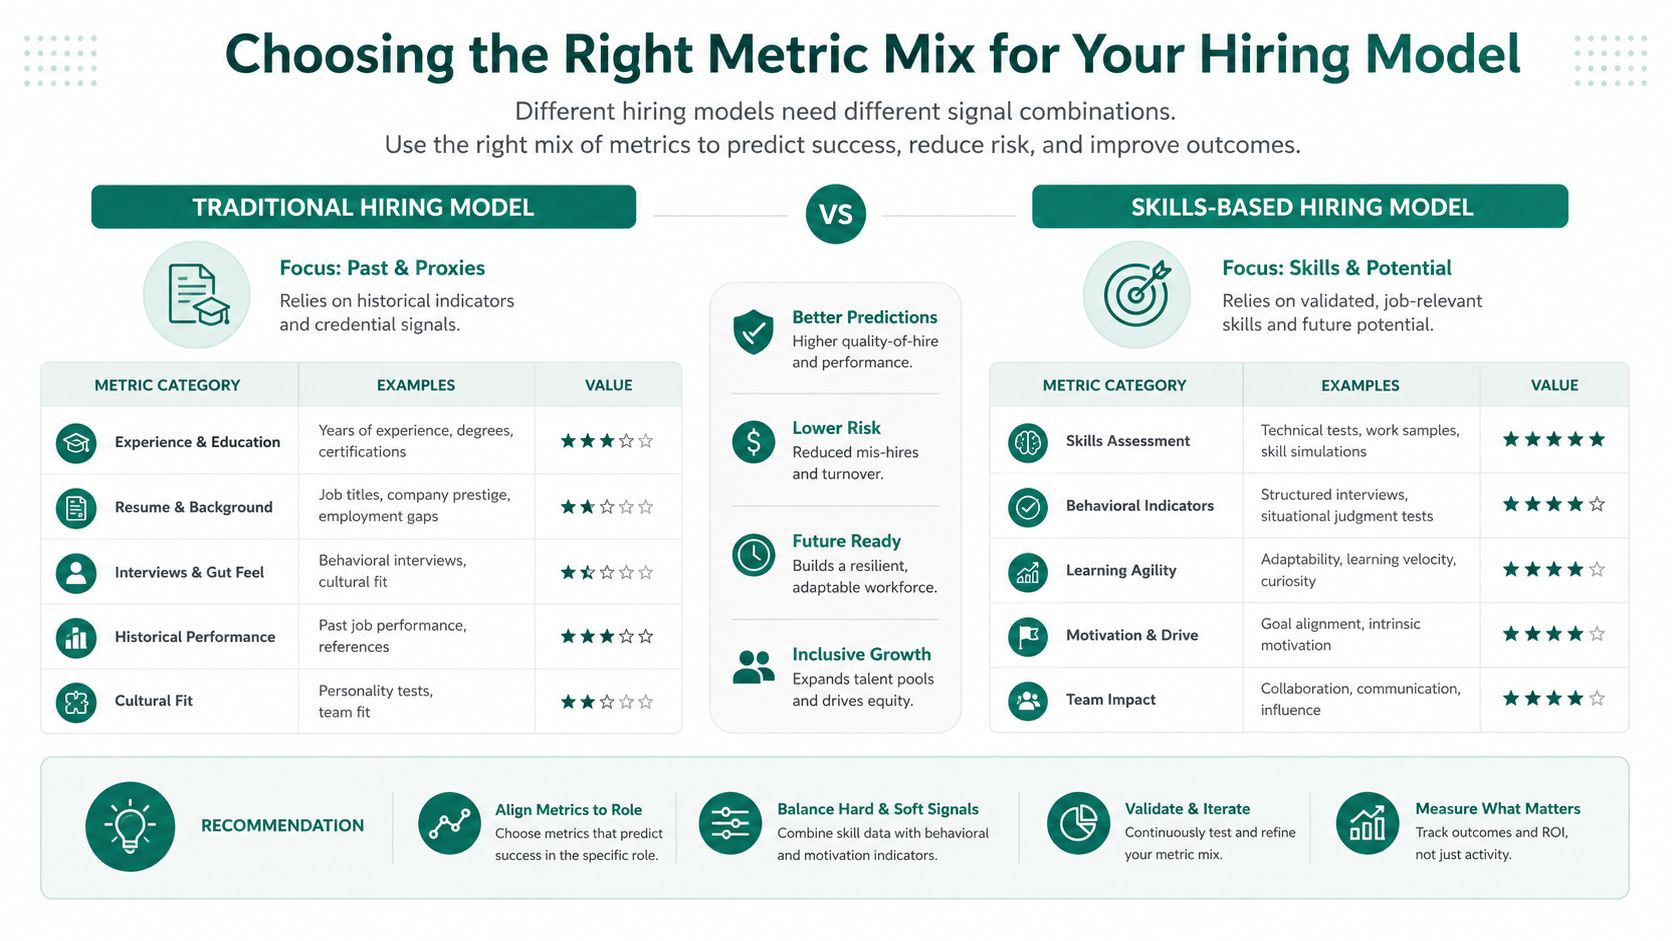
For hourly roles, annual performance reviews arrive too late to guide recruiting or onboarding decisions. Early retention, shift completion, attendance patterns, and time to independent task execution provide faster, though less certain, feedback.
A workable mix includes:
These signals are useful because they arrive quickly, but they are noisy. A missed shift may reflect transportation, scheduling, or poor communication rather than capability. A slow ramp may indicate inadequate training instead of a weak hire. Use the measures to identify cohorts for investigation, not to label individual employees automatically.
Professional roles usually offer stronger lagging indicators. First-year performance, retention, manager satisfaction, and internal mobility can show whether the original selection criteria predicted sustained contribution.
Keep an earlier checkpoint in the model. Track completion of agreed 90-day onboarding milestones, such as owning a defined workflow, delivering a project, or reaching a documented capability level. This does not replace the annual outcome. It gives recruiting and hiring teams time to identify unclear role expectations or onboarding gaps before the review cycle closes.
Recruiting teams commonly examine combinations of performance, retention, manager satisfaction, skills match, and internal mobility. These measures answer different business questions, so a single universal score can conceal more than it explains. Choose the mix based on the decision it must support.
Leading indicators help you act sooner. Lagging indicators help you decide whether your prediction was valid.
Choose three or four measures by rating each candidate metric for speed, validity, and data availability. In high-volume hiring, speed and availability often matter more because annual reviews are incomplete or absent. In professional hiring, sustained performance can carry more weight, even when it takes longer to observe. Document the trade-off, including what the score can and cannot establish.
That discipline matters because many organizations still have no quality-of-hire measurement at all. Start with a small, defensible set of available signals, then add later outcomes as definitions and coverage improve.
Start with the data you already have, not the dashboard you wish you had. Pull a sample of recent hires and check whether the HRIS contains employment status, whether managers complete performance checkpoints, and whether the ATS preserves interview scores after placement.
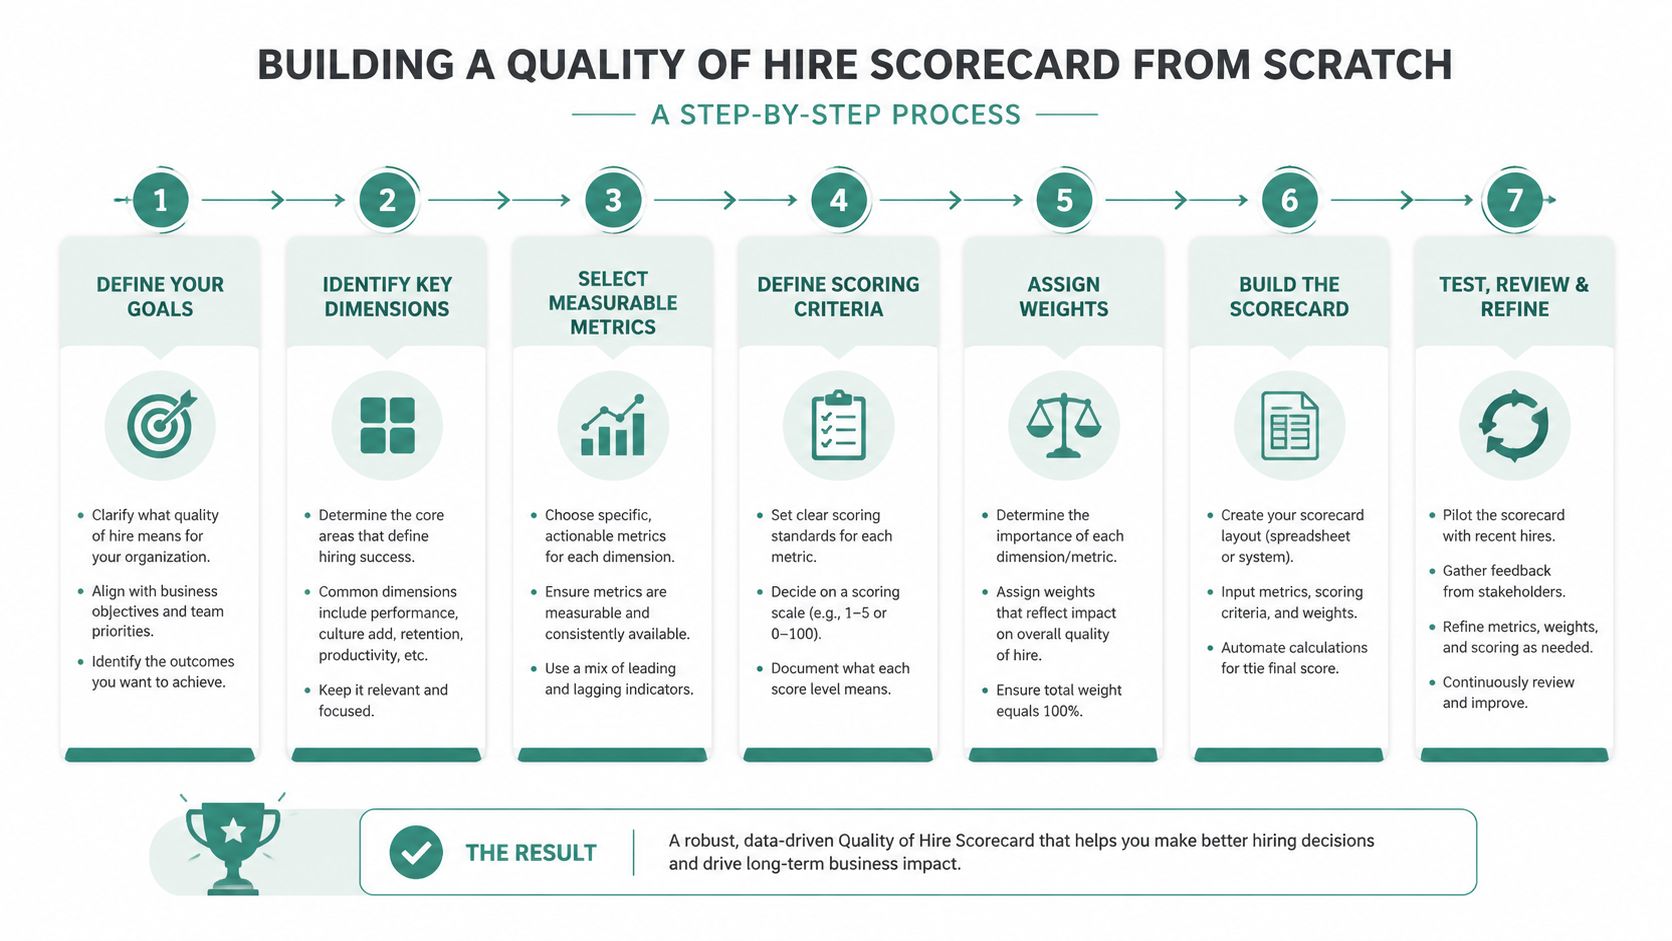
Define outcomes at 30, 90, and 180 days, then add the one-year endpoint when it becomes available. The early checkpoints should use role-specific evidence, such as probation status, independent task completion, or agreed onboarding milestones.
Use a three-metric model when data quality is uneven. For example, combine early retention, a structured manager checkpoint, and ramp status. Move to a weighted composite only when each component has a stable definition and enough historical coverage to justify the extra complexity.
A published composite model combines retention, first annual performance, manager satisfaction, and time to productivity. Its listed benchmarks are 78% for one-year retention, 3.5 out of 5 for performance, 3.8 out of 5 for manager satisfaction, and 4.2 months to productivity (Taleva quality of hire model). Use such a model as a reference point, not a universal target.
Different systems speak different measurement languages. Convert each component to a common scale, record the original value, and retain the eligibility rules. A retention percentage, a five-point manager rating, and a duration measure shouldn't be averaged in their raw forms.
Weight components according to role criticality and data reliability. If ramp data is consistently captured for a technical role but manager surveys are sporadic, the ramp signal may deserve greater analytical confidence. That doesn't mean it automatically deserves a larger business weight. Keep those two decisions separate.
The technical plumbing is straightforward in principle:
Avoid a scorecard that depends on someone remembering to update a spreadsheet. Assign ownership to a TA operations or people analytics lead, set a monthly data-quality check, and give hiring managers a short form with defined response options. Report early signals regularly, then review mature cohorts on a less frequent business cadence.
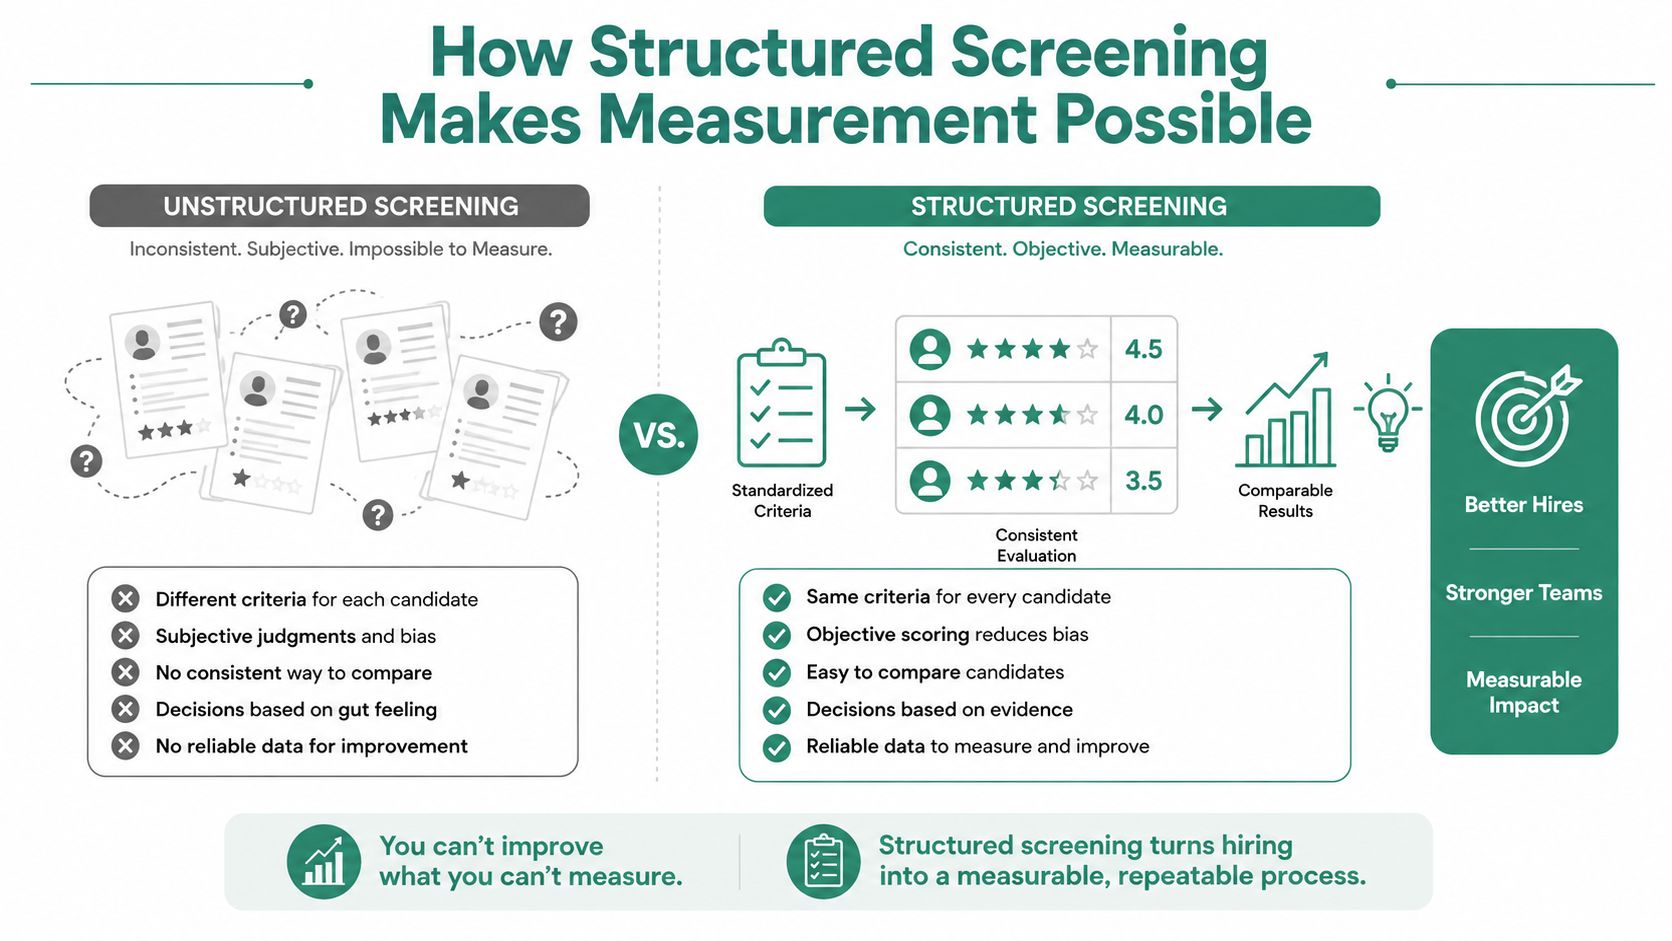
A quality of hire model can't validate pre-hire signals if those signals were collected inconsistently. When one interviewer rates problem-solving, another rates confidence, and a third writes unstructured notes, the organization has no dependable baseline to compare with post-hire performance.
Structured screening creates comparable input data. Define competencies before interviews begin, write behavioral anchors for each rating, and ask candidates consistent questions tied to the role. This lets the organization test whether a particular pre-hire dimension relates to ramp, retention, or performance instead of relying on the strongest anecdote in an interview debrief.
Use the same rubric for at least two to three hiring cycles before drawing correlation conclusions. That period lets the team identify missing fields, inconsistent interviewer behavior, and rating patterns that don't survive calibration.
Talent Pronto's approach uses conversational screening and role-specific criteria to produce structured candidate scorecards. Its integrations with ATS and HRIS platforms can help preserve candidate data and statuses, which reduces the manual re-entry that often causes outcome tracking to fail. Employers evaluating pre-employment assessments can also review Talent Pronto's guide to pre-employment assessments when deciding which signals belong in a structured evaluation.
The same logic applies outside office hiring. Teams designing operational workflows can draw useful process discipline from data-driven fleet operations tips, especially the practice of defining observable standards before reviewing outcomes.
Structured screening also supports fairness because candidates are evaluated against consistent criteria rather than shifting interviewer preferences. It doesn't eliminate bias automatically. The team still needs to inspect the competencies, rating anchors, and outcome data for adverse patterns.
A short video can help hiring teams understand how consistent screening changes the quality of the data they collect.
Once the baseline exists, compare pre-hire ratings with post-hire outcomes by role and cohort. Don't assume a high screening score predicts success only because it sounds job-relevant. Let the outcome data challenge the rubric, then revise the criteria only after reviewing data quality, onboarding conditions, and manager calibration.
A metric can look predictive and still be unacceptable. Tenure at a previous employer, for example, may appear to signal loyalty while also reflecting labor-market access, caregiving constraints, health, geography, or other factors unrelated to the job. School prestige can appear to correlate with capability while acting as a proxy for opportunity and social advantage.
The question isn't only whether a variable correlates with performance. The question is whether it is job-related, consistently measured, explainable, and fair.
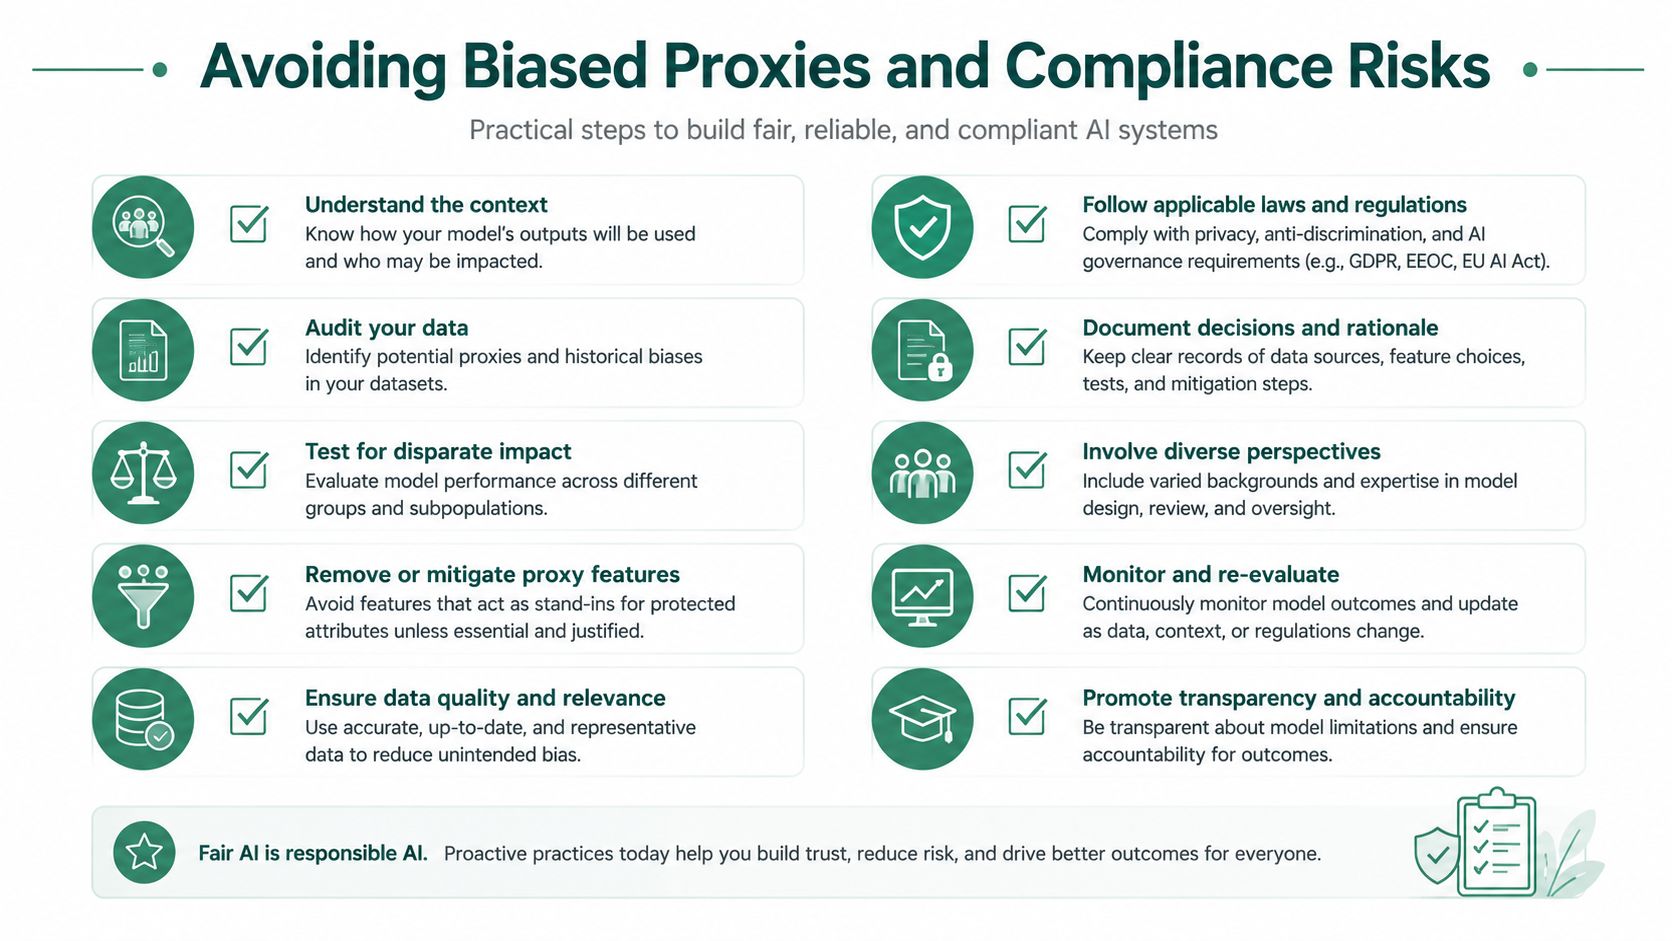
Use a repeatable review before adding a metric to hiring decisions:
The EEOC's selection-procedure framework makes job-relatedness, validation, and documentation central considerations. A measure that performs well statistically but creates substantial fairness concerns may not belong in the model. Accuracy doesn't excuse avoidable discrimination risk.
For a practical explanation of the screening concept, see Talent Pronto's overview of adverse impact. The same audit discipline should apply to post-hire proxies, not only automated assessments.
Manager satisfaction deserves particular caution. A low score may reflect a weak hire, but it may also reflect unclear expectations, insufficient training, workload, or a manager's inconsistent standards. Retention has similar limits. An employee can remain in a role while contributing little, and a strong employee can leave because the role changed.
Review each metric beside its possible confounders. If a proxy repeatedly favors one group and its job connection is weak, remove it rather than adjusting the dashboard until the result looks comfortable. A defensible quality of hire model should help leaders improve selection while protecting candidates and employees from unsupported assumptions.
A mid-market employer with 200 to 800 employees can begin without waiting for a complete annual-review cycle. During weeks one and two, audit ATS fields and identify existing post-hire signals such as probation outcomes, 90-day retention, and the first performance check-in. Use those fields to create a minimal composite with clear eligibility rules.
During weeks three and four, align structured screening criteria with the same outcomes. Configure role-specific scorecards so each interview dimension has a defined rating and can later be compared with early tenure and performance signals. Talent Pronto can support conversational screening and structured scorecards, while its ATS and HRIS integrations can reduce duplicate data entry.
During weeks five and six, send scorecard data into the ATS, build one dashboard connecting pre-hire ratings with early post-hire signals, and review the last two hiring cohorts. The implementation principles described in Talent Pronto's data analytics guide for human resources are useful here because the work depends on connecting existing systems, not adding disconnected reporting.
Start with a model people will maintain. Then improve the weights, add mature outcomes, and retire weak proxies as evidence accumulates.
Talent Pronto provides conversational applicant screening, role-specific questions, structured scorecards, candidate ranking, and ATS or HRIS integrations that can connect hiring inputs with quality of hire metrics. Visit Talent Pronto to see how its screening workflow can help your team build a more consistent, measurable hiring process.

Talent Pronto is an AI-powered hiring platform built around Anna, our intelligent AI that conducts 24/7 conversational screening, evaluates candidates against specific job requirements and compliance needs, and schedules interviews. Run everything on the Talent Pronto ATS, our all-in-one applicant tracking system with a branded careers site and Anna built in, or keep your existing ATS and let Anna integrate with Greenhouse, Ashby, iCIMS, Jobvite, Lever, Oracle, and more. Either way, we help organizations reduce time-to-hire and build stronger teams.