Master time to fill metrics with exact formulas, 2026 benchmarks by role, dashboard tips, and proven ways to cut hiring cycle time without sacrificing quality.

A hiring cycle that once averaged 36 days in 2024 reached 42 days in 2025, then climbed to 63 to 68 days by January 2026, according to recent time-to-hire benchmarking. That change takes an open role from a manageable vacancy to an operational liability. At 42 days, a position can remain unfilled for six weeks. At 63 to 68 days, the vacancy extends beyond nine weeks.
Time to fill metrics show more than how quickly recruiters close requisitions. They expose the combined effect of approval delays, sourcing capacity, screening throughput, interview scheduling, hiring-manager responsiveness, and offer turnaround. When the number rises, the problem usually sits in the system, not with one recruiter or one difficult candidate.
The latest benchmark trajectory deserves executive attention because 63 to 68 days is nearly double the 2023 range of 36 to 44 days, based on the same industry benchmark. A vacancy lasting that long can delay project delivery, force existing employees to absorb additional work, and leave managers operating below planned capacity.
The metric matters because it captures the full requisition-to-acceptance window. It includes the work that happens before a candidate enters the funnel, not only the recruiter's screening and interview activity. A hiring team can have strong sourcing results and still report a poor time to fill if approvals sit in an inbox, interview panels respond slowly, or offers require several rounds of review.
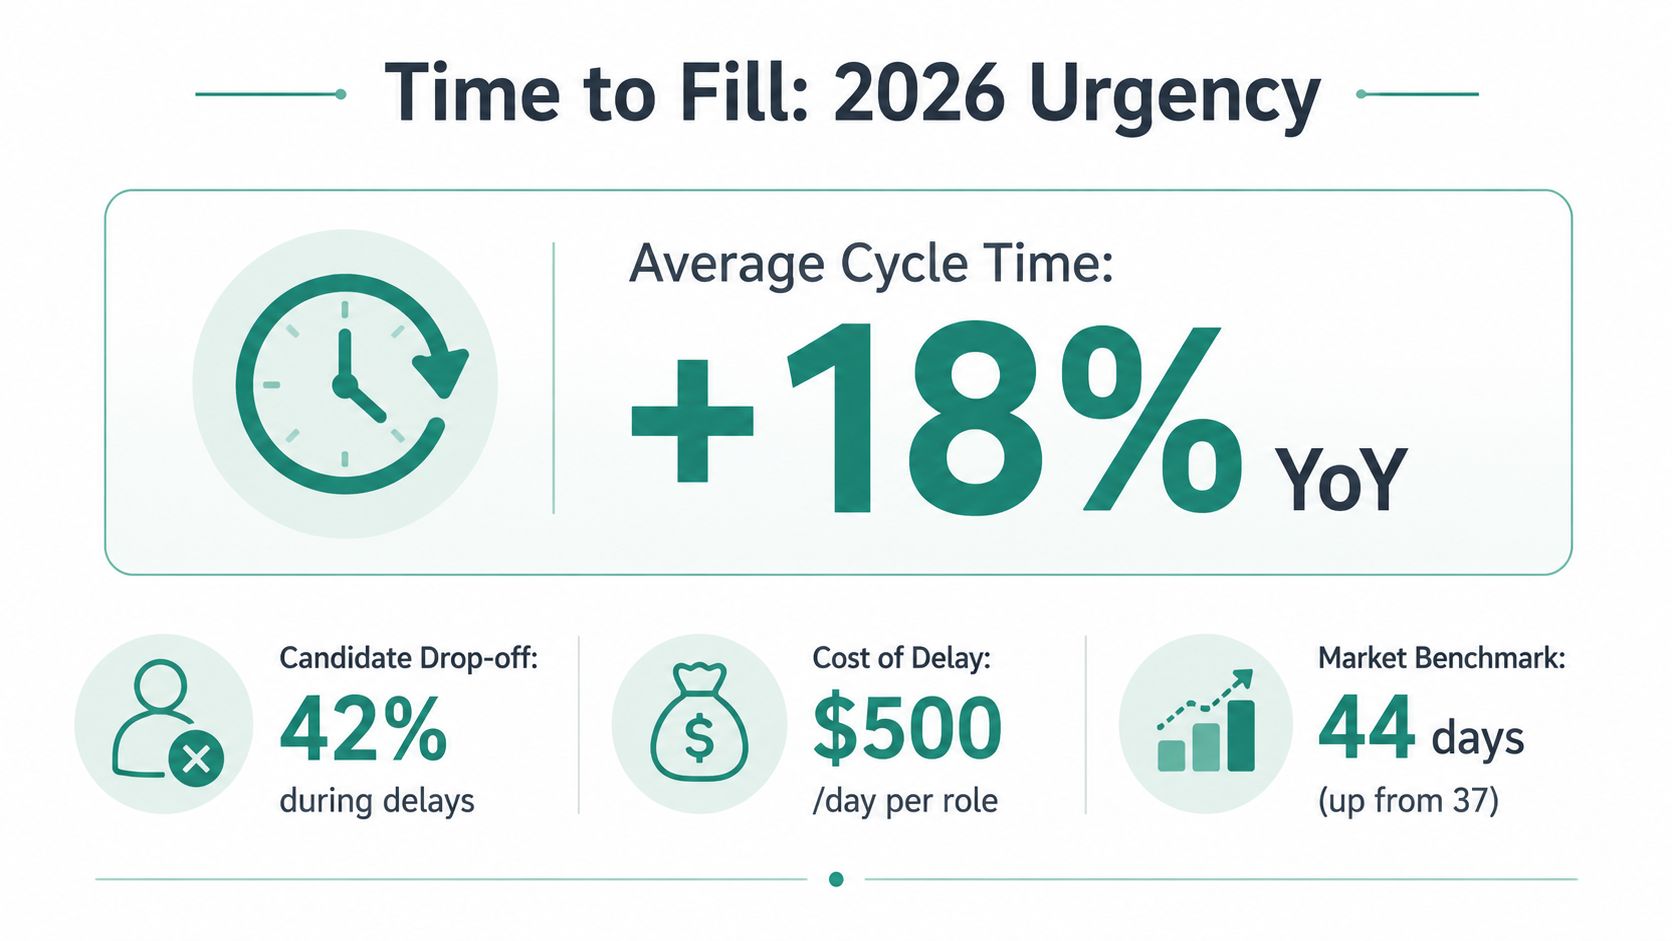
The visible metric is a number of days. The operational cost appears elsewhere:
A rising figure can also indicate tighter labor supply, but it shouldn't be dismissed as a market problem. The metric combines external and internal factors. If a team can't separate approval time, sourcing time, screening time, interview time, and offer time, leaders can't tell whether the constraint is talent availability or process design.
Practical rule: Treat time to fill as a diagnostic signal. Don't manage it as a recruiter scoreboard.
The right executive question isn't just, “Why are we hiring slowly?” It's, “Which handoff adds the most calendar time, and what can we change without lowering hiring quality?” That shift turns the metric from a retrospective report into a workforce-planning control.
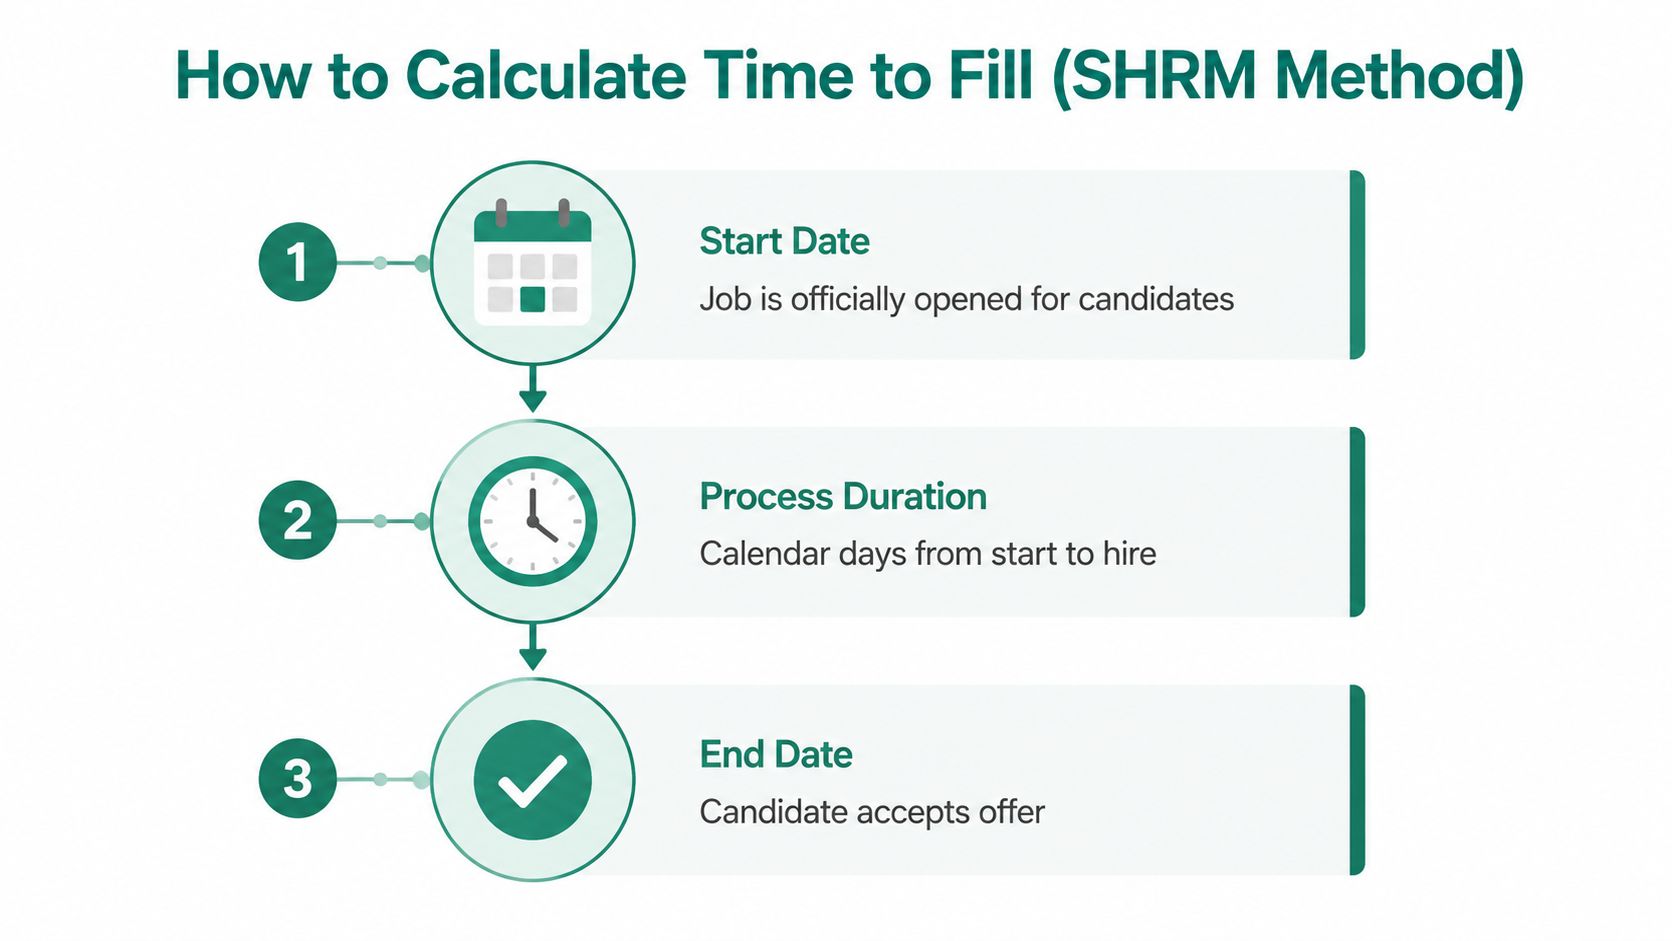
SHRM defines time to fill as calendar days from requisition opening until the candidate accepts the offer, including weekends and holidays, as documented in its Talent Access Report. Your ATS should use one consistent opening event and one consistent acceptance event for every comparable requisition.
Use this calculation:
Time to fill = offer acceptance date minus requisition opening date
The opening date should represent the point at which the approved role is officially available for candidates. The end date should represent the candidate's acceptance of the offer, not the first day of work, background-check completion, or onboarding.
For example, if a requisition opens on a Monday and the candidate accepts the offer 39 calendar days later, the time to fill is 39 days, even if weekends and holidays occur during that period. The calculation should remain consistent across departments, locations, and recruiters.
Paused requisitions, withdrawn offers, internal transfers, evergreen requisitions, and roles that close without a hire need explicit treatment. Don't remove records because they make the average look worse. Create documented inclusion rules, then report excluded populations separately so leaders can see how much of the funnel sits outside the headline metric.
Oregon's Department of Administrative Services offers a useful example of formal governance. Its expectation says average time to fill shouldn't exceed 50 days, while its specific clock runs from the job posting date in Workday to the point when the candidate enters the offer stage. The policy also identifies exclusions, including direct appointments, evergreen requisitions, roles open 24 hours or less, and executive recruitments, as described in the Oregon time-to-fill expectation FAQ.
Data quality follows the same principle used in operational reporting. Teams that need a broader explanation of freshness, timestamps, and monitoring can review this data timeliness definition and metrics. A reliable time to fill dashboard depends on the same discipline: defined events, documented exceptions, and repeatable timestamps.
These metrics answer different management questions. Time to fill measures the organization's full hiring cycle. Time to hire measures the candidate's journey from application to acceptance. Time in stage identifies the duration of a specific step, such as screening, interview scheduling, or hiring-manager review.
Confusing them creates bad interventions. A long time to fill with a short time to hire may indicate that approvals or sourcing consume the cycle. A long time to hire with a normal time to fill may point to slow screening, interviews, or decisions after candidates apply.
| Metric | Scope | Primary Use Case | When to Track |
|---|---|---|---|
| Time to fill | Requisition opening to offer acceptance | Workforce planning and full-process efficiency | Executive dashboards and role-family reviews |
| Time to hire | Candidate application to offer acceptance | Candidate journey and selection speed | Recruiter and hiring-manager performance reviews |
| Time in stage | Entry into one workflow stage to exit | Bottleneck identification | Weekly operating reviews and process audits |
SHRM's definition makes time to fill a calendar-based operational measure rather than an interview-only measure. Its cited research reported an average of 33.28 days across positions, while later benchmarking separates nonexecutive and executive populations. Those figures shouldn't be mixed with a time-to-hire calculation because the start event is different. See SHRM's explanation of time to fill as a staffing metric for the formal definition and scope.
Candidate experience needs its own view. An organization might improve its overall fill rate while still leaving applicants without updates or forcing them through unnecessary steps. Track time to hire alongside candidate communication and satisfaction measures, including the broader framework in candidate experience metrics.
Use the metric that matches the decision. Workforce leaders need time to fill. Recruiters need time in stage. Hiring managers need time to hire and decision latency. One number can't explain all three.
Headline averages conceal meaningful variation. SHRM-based 2026 reporting places median time to fill at 39 calendar days for nonexecutive roles and 45 days for executive roles, with the nonexecutive figure down from 44 days in 2025. The latest benchmark indicates that executive hiring isn't dramatically slower than nonexecutive hiring in that dataset, so seniority alone shouldn't determine the target. Review the underlying SHRM Talent Access benchmarking report before comparing your organization with a market figure.
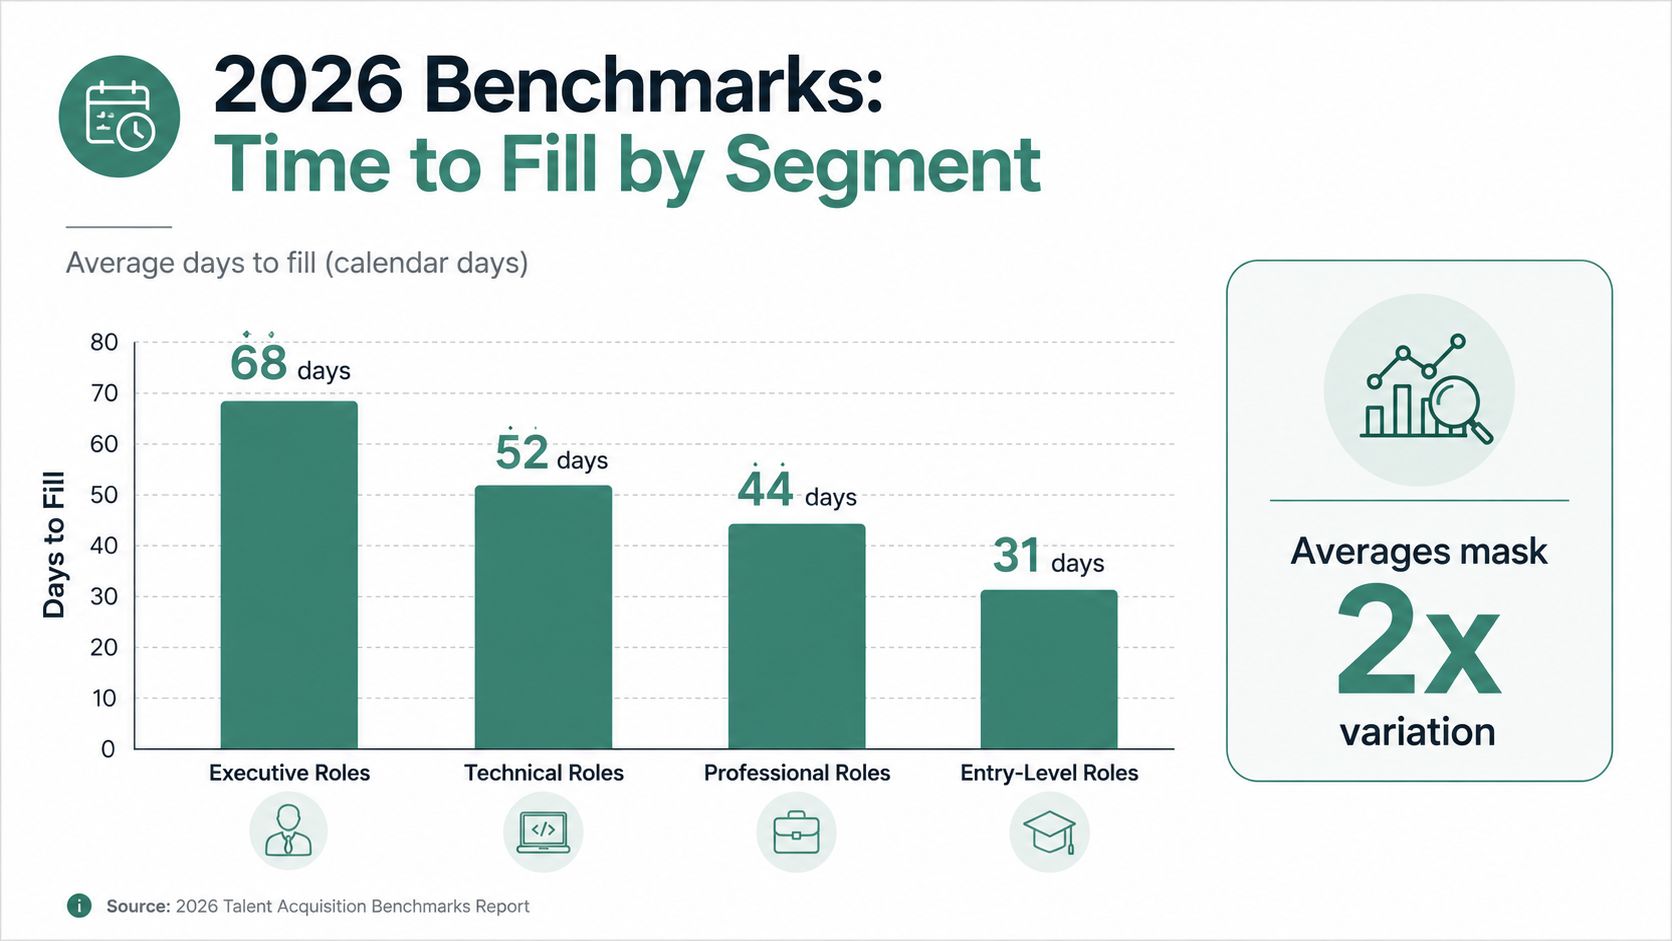
Role complexity changes the operating conditions. Independent HR analysis cited by SHRM notes that technical and specialized roles commonly run 50 to 70 or more days, while professional roles often fall around 35 to 60 days, as reflected in SHRM recruiting benchmarking guidance. Niche skills, technical assessments, credential checks, and limited candidate supply can extend the process even when the workflow is well managed.
Recruiter capacity also matters. SHRM reported that extra-large organizations saw a 67% increase in median requisitions per recruiter in 2026. If screening, scheduling, and handoffs remain manual, a workload increase of that scale can lengthen cycle time without any change in recruiter capability.
Build internal benchmarks by segmenting:
A healthcare system shouldn't use one target for every opening. Nursing roles may need a specialized pipeline, credential verification, and rapid screening, while administrative roles may follow a simpler process. The useful comparison is against the organization's own historical performance for similar roles, not an attractive but irrelevant average.
External sourcing choices can also affect segmentation. Teams evaluating best remote staffing agencies should still compare source, role family, location, and acceptance outcomes rather than assuming every remote channel produces the same cycle time.
A dashboard that shows only average time to fill is a wall clock with no map. It tells leaders that the process is slow, but not whether the delay sits in approvals, sourcing, screening, interviews, decisions, or offers.
Start with a top-level view that shows median and average time to fill, open requisition age, filled requisitions by role family, and offer acceptance. Then add drill-downs that explain the movement. A median can show the typical experience, while an average can reveal the influence of unusually long searches. Use both, but don't use either as a substitute for stage-level analysis.

A practical layout has three layers:
Use a cohort view to compare requisitions opened in the same period. A requisition opened recently may still be active, while an older completed requisition has a full cycle behind it. Mixing those populations can make a current process look better or worse than it is.
Extract the fields your ATS already records, including requisition open date, stage-entry and stage-exit timestamps, interview scheduling events, offer creation, offer acceptance, withdrawal, and closure reason. Reconcile those fields against HRIS outcomes before publishing the dashboard. For a broader operating model, data analytics in human resources provides useful context for connecting recruiting data with workforce reporting.
Refresh the operating view frequently enough to support intervention. Recruiters need current queues, hiring managers need overdue actions, and executives need a stable trend rather than a constantly shifting snapshot. Access controls should also match responsibility. Give leaders aggregate visibility, recruiters actionable requisition detail, and hiring managers the records required for their decisions.
Dashboard test: Every red number should lead to an owner, a next action, and a due date.
Screening is often the most effective place to reduce waiting because it sits early in the funnel and affects every applicant. Manual review creates queues. Recruiters wait for candidates to respond, coordinate schedules, repeat basic questions, and transfer notes into the ATS. Hiring teams then wait again for a consistent recommendation.
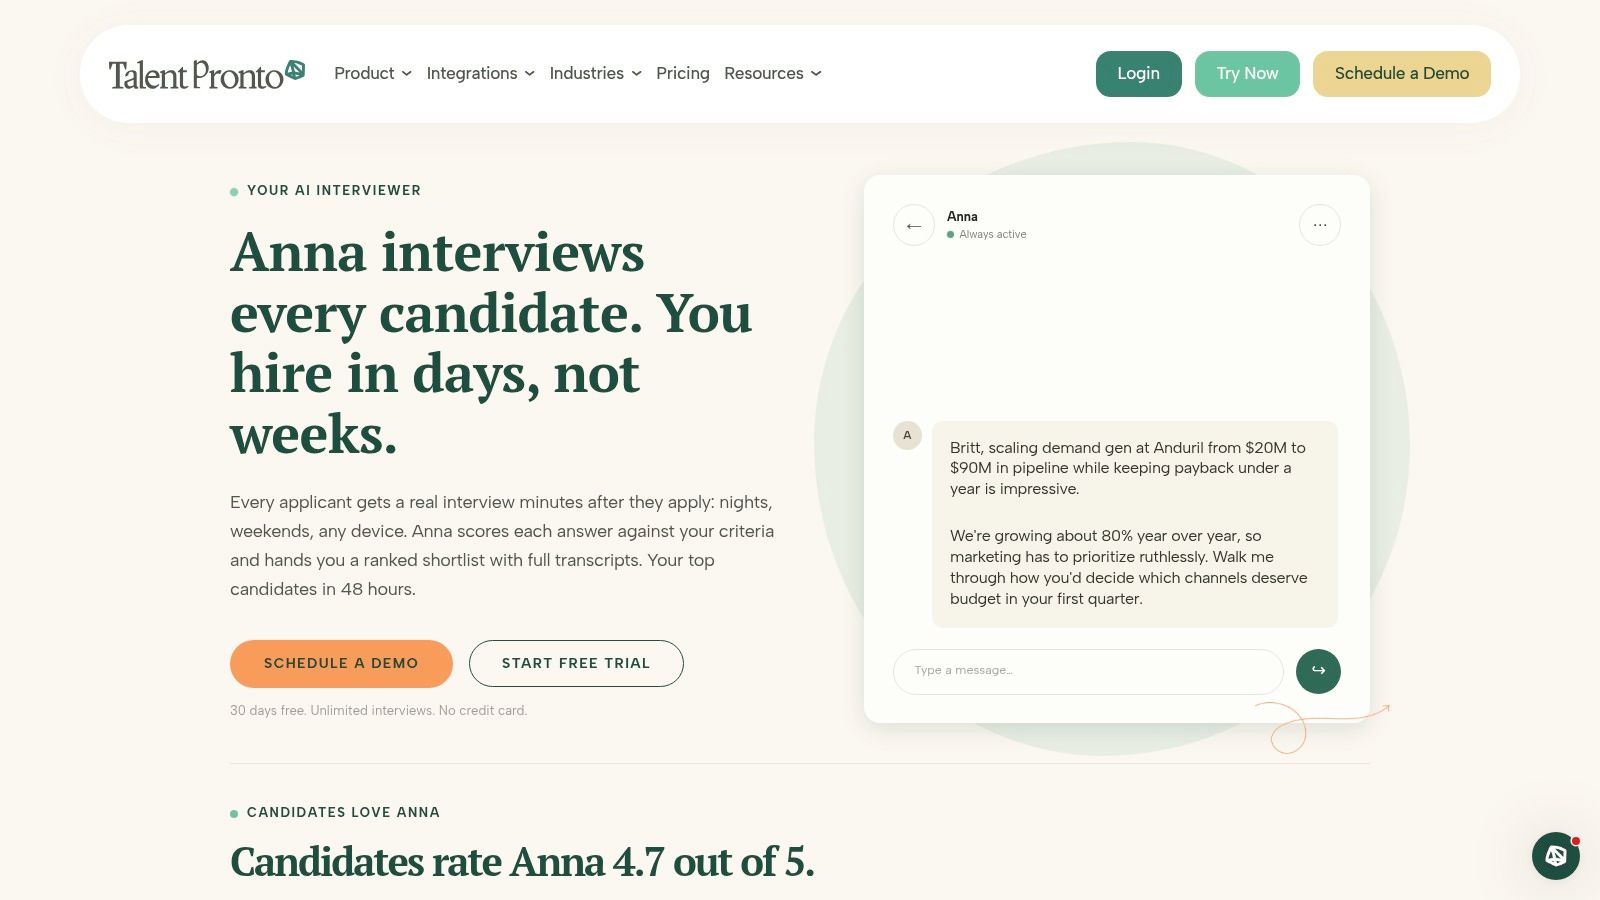
Automation doesn't solve unclear job requirements or slow approvals, but it can remove avoidable waiting from the first candidate interaction. Talent Pronto, for example, uses conversational screening to engage applicants across web and mobile, ask role-specific behavioral and technical questions, evaluate responses against employer-defined criteria, and prepare structured scorecards. Its virtual assistant, Anna, can engage candidates at any hour, while employers retain advancement and rejection decisions.
The strongest implementation pattern is not “let the system hire.” It's “let the system gather comparable evidence, then let trained people decide.” A structured rubric can standardize early questions, capture answers in the same format, and give recruiters a clearer basis for advancing candidates.
Useful capabilities include:
Teams considering this approach should define the rubric before deployment, audit outputs for consistency, preserve candidate opt-out options, and keep final decisions with the employer. The relevant question isn't whether automation feels modern. It's whether it shortens the interval between application, evidence collection, review, and interview without lowering the standard.
For a closer look at the workflow category, review this AI resume screening tool guide.
A typical implementation can be completed in 1 to 3 weeks, according to the product information provided for Talent Pronto. Start with one role family, establish a baseline, and measure screening completion, qualified-candidate progression, recruiter review time, and time in the early funnel before expanding.
The trade-off is real. Poorly configured automation can reject viable candidates, create a frustrating interaction, or encode weak criteria at scale. The safeguard is equally practical: use employer-defined requirements, structured evaluation, human review, regular audits, and transparent exception handling. Automation should compress administrative delay, not compress thoughtful judgment.
Most unreliable time to fill metrics don't fail because the arithmetic is difficult. They fail because teams start the clock at different moments, stop it at different moments, or remove inconvenient requisitions.
A recruiter may start counting when a role is approved. Another team may start when the job posts. A third may stop at offer creation rather than acceptance. Each approach can be valid for a different operational metric, but they can't be combined into one benchmark without distorting the result.
Check these points with your ATS administrator and HRIS team:
The last point matters most. Removing hard-to-fill roles can produce a flattering average that doesn't describe the workforce problem leaders are trying to solve. Pausing a requisition may be appropriate when funding or headcount is unavailable, but the paused interval should remain visible in a separate operational view.
A historical benchmark reported a 44-day average time to fill, up from 33 days in 2021, a 33% increase over that period, as summarized in time to fill versus time to hire benchmarking. The comparison is useful only if the underlying definitions remain stable. If your organization changes the clock or exclusions, annotate the dashboard rather than presenting the new figure as a clean trend.
Audit principle: A less flattering metric with stable definitions is more valuable than an impressive metric nobody can reproduce.
Start with measurement, then remove the largest queue.
This week: Lock the opening and acceptance timestamps, publish inclusion rules, and separate paused, evergreen, internal, and withdrawn populations. Add time in stage to the dashboard so every delay has an owner.
Over the next 1 to 3 months: Set role-family benchmarks, remove unnecessary approval handoffs, create hiring-manager response expectations, and pilot screening automation for a high-volume or slow-moving job family. Track early-funnel duration, screening completion, qualified-candidate progression, and offer acceptance alongside time to fill.
Over the next quarter: Connect ATS, HRIS, scorecard, and workforce-planning data. Review recruiter capacity, redesign approval workflows, and compare source performance by role and location. Teams that need broader market visibility can also explore how to enhance hiring strategy through data scraping, while keeping external signals separate from internal performance metrics.
Bring executives a simple argument: fix the timestamp rules first, identify the stage consuming the most calendar time, then automate the repetitive work that creates the queue. That sequence protects quality while making improvement measurable.
Talent Pronto provides conversational screening, structured scorecards, candidate engagement, scheduling support, and ATS or HRIS synchronization to help teams reduce early-funnel delays without adding recruiter headcount. Visit Talent Pronto to see how its screening workflow can fit your hiring process and help turn time to fill metrics into an operating tool.

Talent Pronto is an AI-powered hiring platform built around Anna, our intelligent AI that conducts 24/7 conversational screening, evaluates candidates against specific job requirements and compliance needs, and schedules interviews. Run everything on the Talent Pronto ATS, our all-in-one applicant tracking system with a branded careers site and Anna built in, or keep your existing ATS and let Anna integrate with Greenhouse, Ashby, iCIMS, Jobvite, Lever, Oracle, and more. Either way, we help organizations reduce time-to-hire and build stronger teams.